

Screening of prognostic biomarkers for endometrial carcinoma based on a ceRNA network
- PMID: 30581678
- PMCID: PMC6292375
- DOI: 10.7717/peerj.6091
Screening of prognostic biomarkers for endometrial carcinoma based on a ceRNA network
Abstract
Objective: This study aims to reveal the regulation network of lncRNAs-miRNAs-mRNA in endometrial carcinoma (EC), to investigate the underlying mechanisms of EC occurrence and progression, to screen prognostic biomarkers.
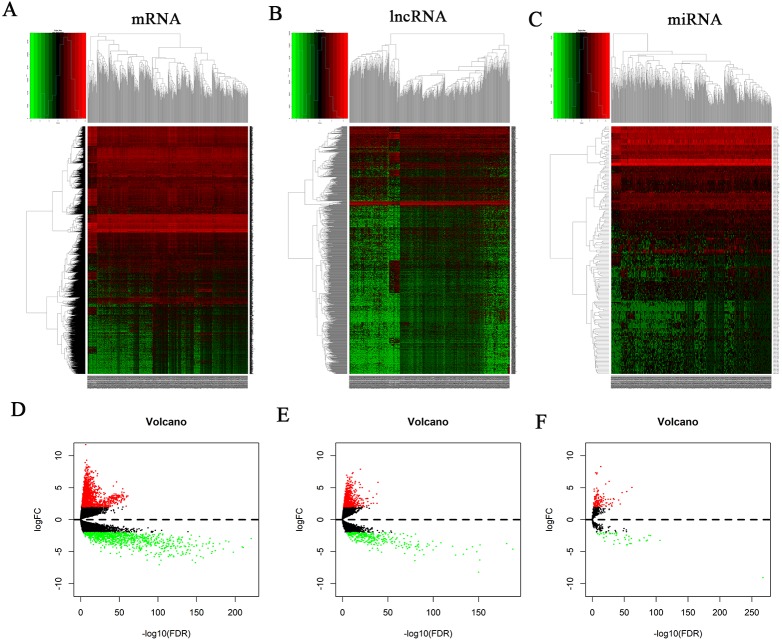
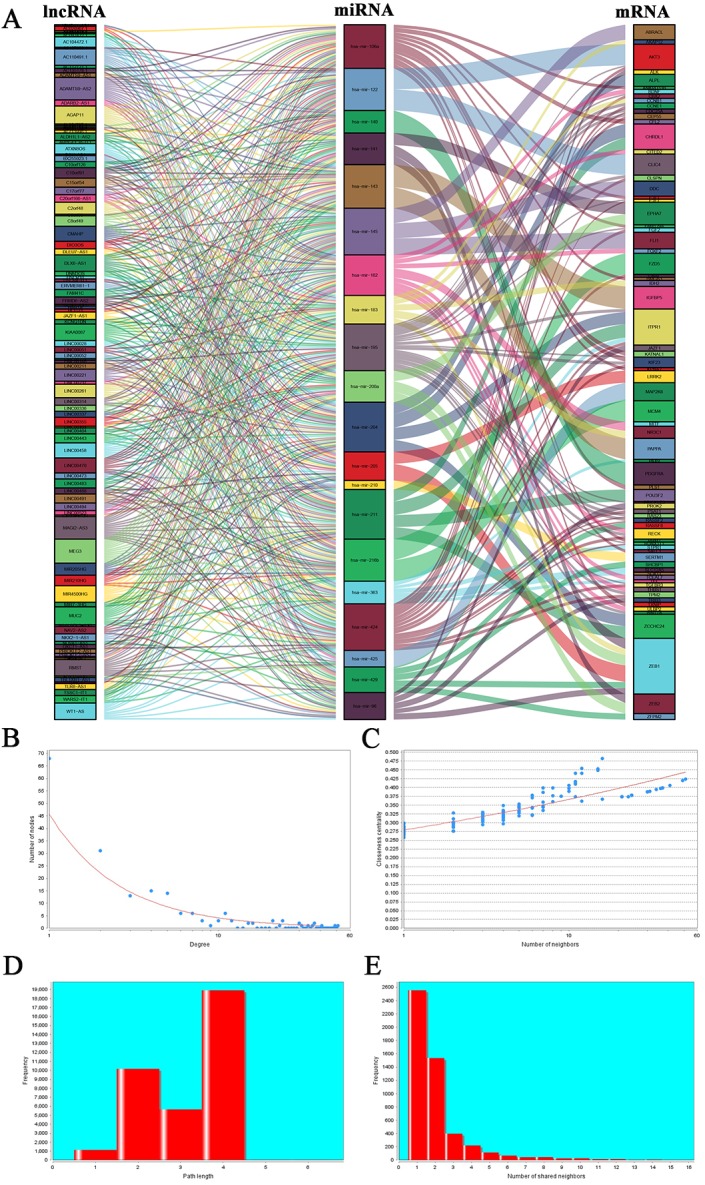
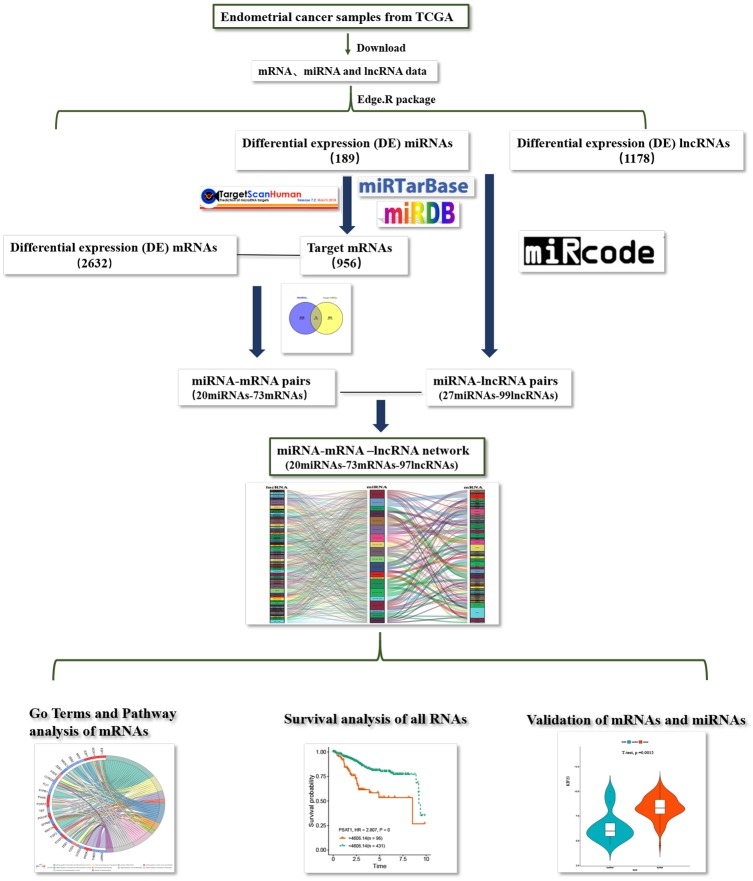
Methods: RNA-seq and miRNA-seq data of endometrial carcinoma were downloaded from the TCGA database. Edge.R package was used to screen differentially expressed genes. A database was searched to determine differentially expressed lncRNA-miRNA and miRNA-mRNA pairs, to construct the topological network of ceRNA, and to elucidate the key RNAs that are for a prognosis of survival.
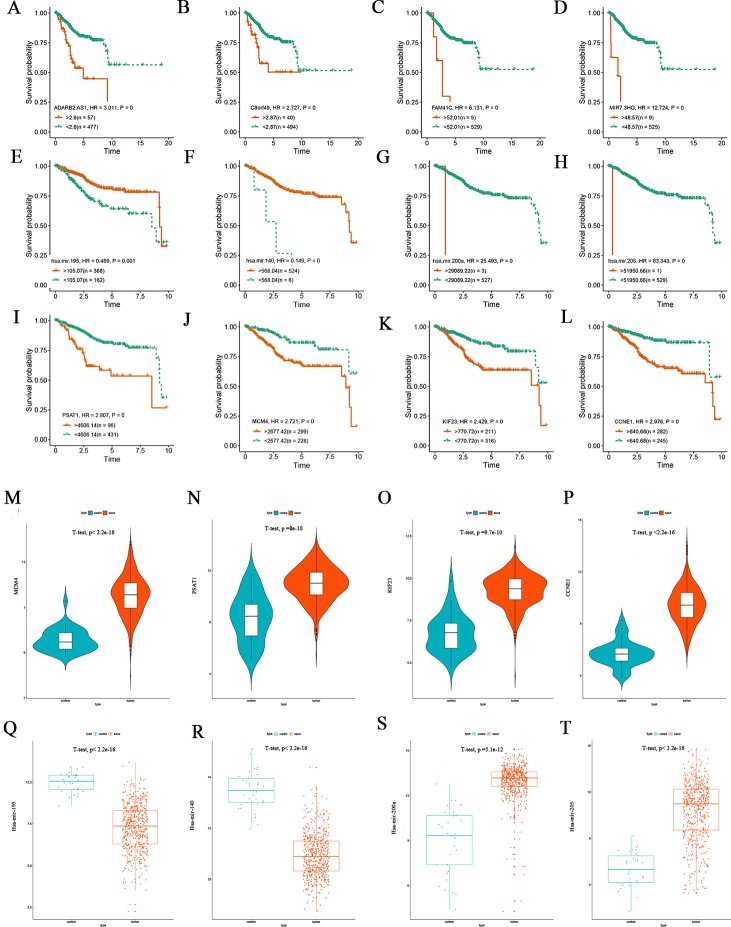
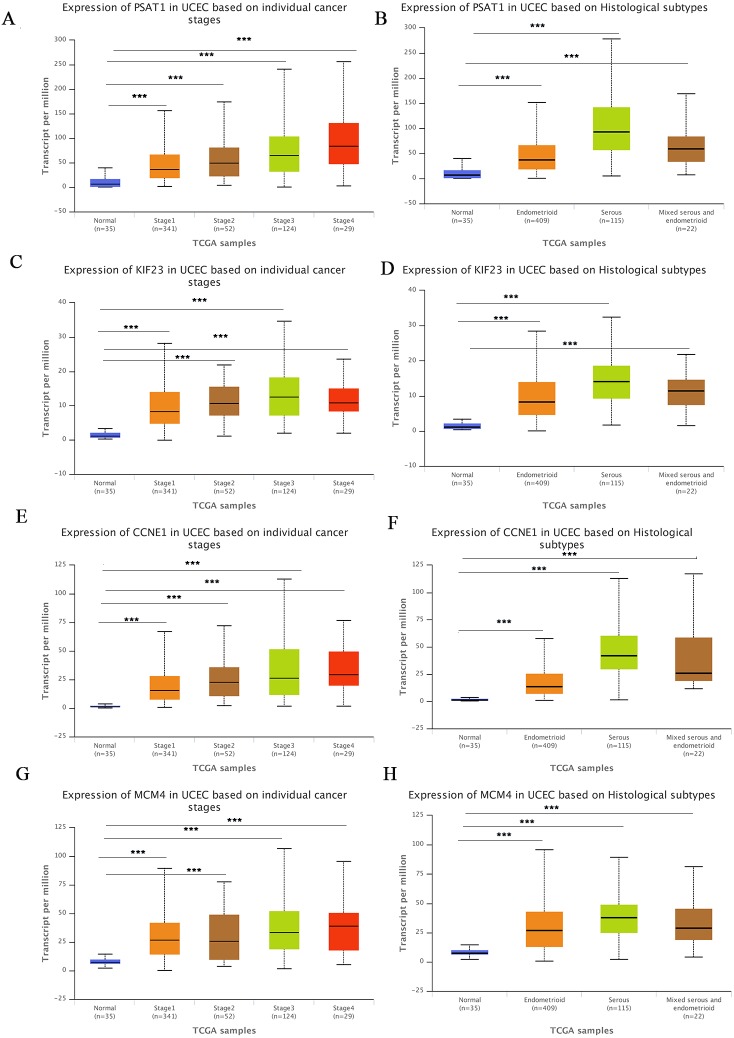
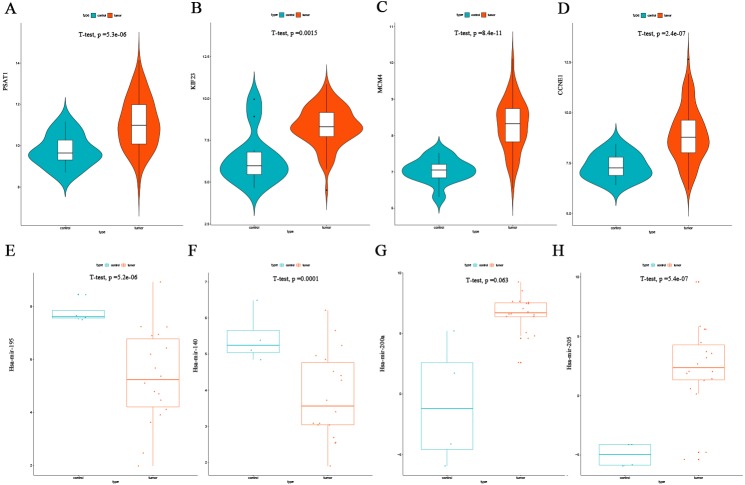
Results: We screened out 2632 mRNAs, 1178 lncRNAs and 189 miRNAs that were differentially expressed. The constructed ceRNA network included 97 lncRNAs, 20 miRNAs and 73 mRNAs. Analyzing network genes for associations with prognosies revealed 169 prognosis-associated RNAs, including 92 lncRNAs, 16miRNAs and 61 mRNAs.
Conclusion: Our results reveal new potential mechanisms underlying the carcinogenesis and progression of endometrial carcinoma.
Keywords: Endometrial carcinoma; Prognostic biomarker; ceRNA network.
Conflict of interest statement
The authors declare there are no competing interests.
Figures

Similar articles
-
Comprehensive analysis of differentially expressed profiles of lncRNAs, mRNAs, and miRNAs in laryngeal squamous cell carcinoma in order to construct a ceRNA network and identify potential biomarkers.J Cell Biochem. 2019 Oct;120(10):17963-17974. doi: 10.1002/jcb.29063. Epub 2019 May 24. J Cell Biochem. 2019. PMID: 31127661
-
Identifying prognostic biomarkers in endometrial carcinoma based on ceRNA network.J Cell Biochem. 2020 Mar;121(3):2437-2446. doi: 10.1002/jcb.29466. Epub 2019 Nov 6. J Cell Biochem. 2020. PMID: 31692050
-
Comprehensive Analysis of Differentially Expressed Profiles of lncRNAs/mRNAs and miRNAs with Associated ceRNA Networks in Triple-Negative Breast Cancer.Cell Physiol Biochem. 2018;50(2):473-488. doi: 10.1159/000494162. Epub 2018 Oct 11. Cell Physiol Biochem. 2018. PMID: 30308479
-
Reconstruction and Analysis of the Differentially Expressed IncRNA-miRNA-mRNA Network Based on Competitive Endogenous RNA in Hepatocellular Carcinoma.Crit Rev Eukaryot Gene Expr. 2019;29(6):539-549. doi: 10.1615/CritRevEukaryotGeneExpr.2019028740. Crit Rev Eukaryot Gene Expr. 2019. PMID: 32422009 Review.
-
The Role of miRNAs in the Regulation of Endometrial Cancer Invasiveness and Metastasis-A Systematic Review.Cancers (Basel). 2021 Jul 6;13(14):3393. doi: 10.3390/cancers13143393. Cancers (Basel). 2021. PMID: 34298609 Free PMC article. Review.
Cited by
-
Identification of the 11-lncRNA signatures associated with the prognosis of endometrial carcinoma.Sci Prog. 2021 Jan-Mar;104(1):368504211006593. doi: 10.1177/00368504211006593. Sci Prog. 2021. PMID: 33781143 Free PMC article.
-
Advancements in Minimally Invasive Techniques and Biomarkers for the Early Detection of Endometrial Cancer: A Comprehensive Review of Novel Diagnostic Approaches and Clinical Implications.J Clin Med. 2024 Dec 11;13(24):7538. doi: 10.3390/jcm13247538. J Clin Med. 2024. PMID: 39768459 Free PMC article. Review.
-
Identification of KIF23 as a prognostic signature for ovarian cancer based on large-scale sampling and clinical validation.Am J Transl Res. 2020 Sep 15;12(9):4955-4976. eCollection 2020. Am J Transl Res. 2020. PMID: 33042400 Free PMC article.
-
Comprehensive Analysis of Prognostic Alternative Splicing Signatures in Endometrial Cancer.Front Genet. 2020 May 29;11:456. doi: 10.3389/fgene.2020.00456. eCollection 2020. Front Genet. 2020. PMID: 32547595 Free PMC article.
-
The interplay of sex steroid hormones and microRNAs in endometrial cancer: current understanding and future directions.Front Endocrinol (Lausanne). 2023 Apr 21;14:1166948. doi: 10.3389/fendo.2023.1166948. eCollection 2023. Front Endocrinol (Lausanne). 2023. PMID: 37152960 Free PMC article. Review.
References
-
- Allard J, Risinger JI, Day R, Chandran U, Litzi T, Rose G, Berchuck A, Maxwell GL. Microarray analysis of microdissected stage i endometrial cancers reveals gene expression patterns associated with inflammation. Gynecologic Oncology. 2008;108(3):S80–S81.
-
- Chou CH, Chang NW, Shrestha S, Hsu SD, Lin YL, Lee WH, Yang CD, Hong HC, Wei TY, Tu SJ, Tsai TR, Ho SY, Jian TY, Wu HY, Chen PR, Lin NC, Huang HT, Yang TL, Pai CY, Tai CS, Chen WL, Huang CY, Liu CC, Weng SL, Liao KW, Hsu WL, Huang HD. miRTarBase 2016: updates to the experimentally validated miRNA-target interactions database. Nucleic Acids Research. 2016;44(D1):D239–D247. doi: 10.1093/nar/gkv1258. - DOI - PMC - PubMed
LinkOut - more resources
Full Text Sources
