. 2018 Oct 23;5(12):1800560.
doi: 10.1002/advs.201800560. eCollection 2018 Dec.

Enhanced Raman Investigation of Cell Membrane and Intracellular Compounds by 3D Plasmonic Nanoelectrode Arrays

Affiliations

Enhanced Raman Investigation of Cell Membrane and Intracellular Compounds by 3D Plasmonic Nanoelectrode Arrays

Valeria Caprettini et al. Adv Sci (Weinh). .

Abstract

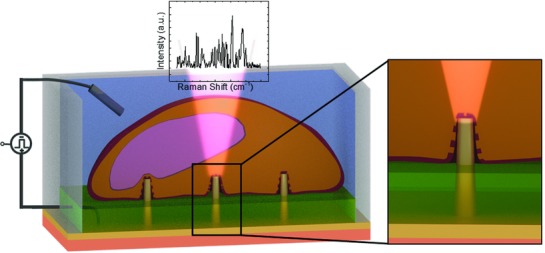
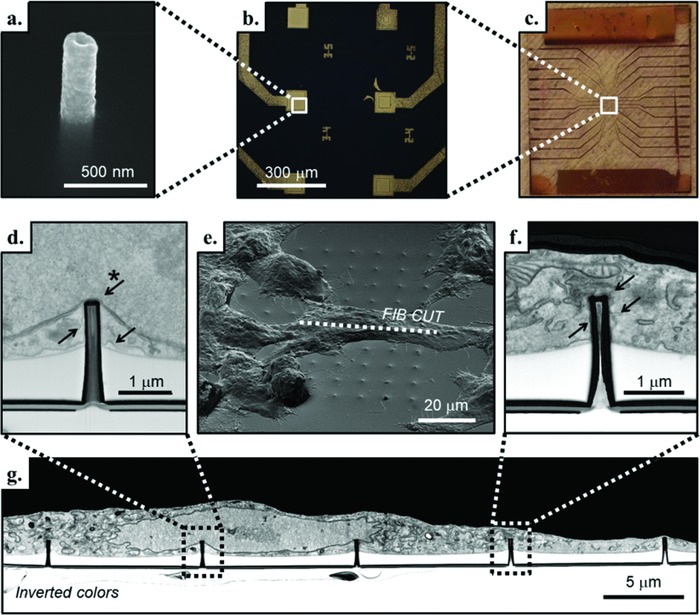
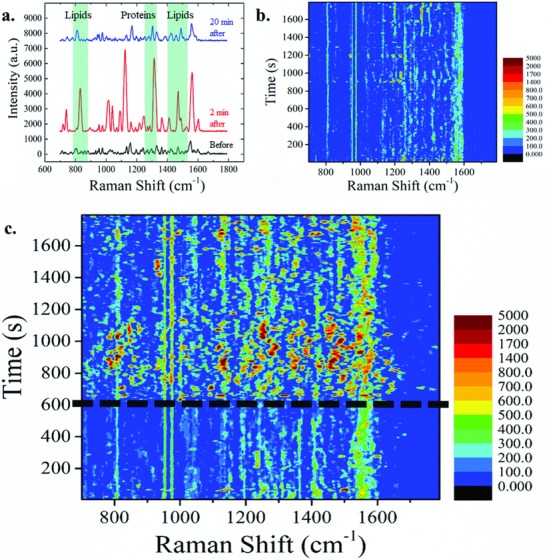
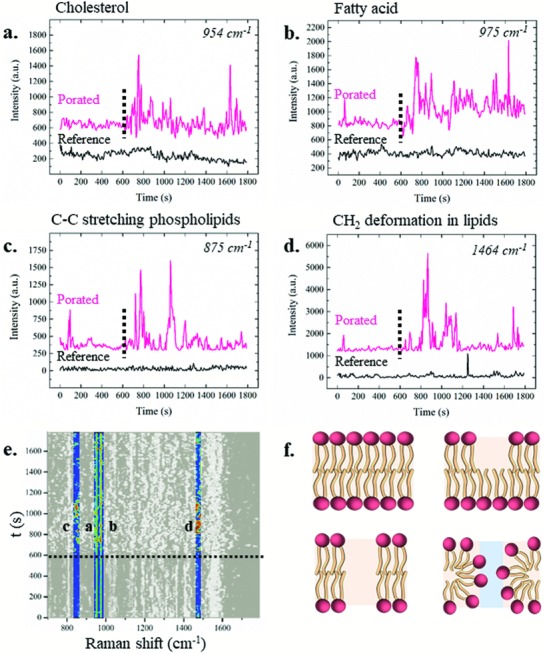
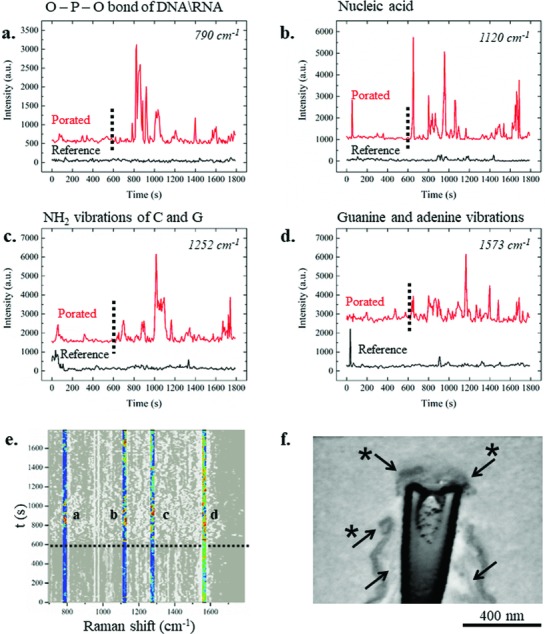
3D nanostructures are widely exploited in cell cultures for many purposes such as controlled drug delivery, transfection, intracellular sampling, and electrical recording. However, little is known about the interaction of the cells with these substrates, and even less about the effects of electroporation on the cellular membrane and the nuclear envelope. This work exploits 3D plasmonic nanoelectrodes to study, by surface-enhanced Raman scattering (SERS), the cell membrane dynamics on the nanostructured substrate before, during, and after electroporation. In vitro cultured cells tightly adhere on 3D plasmonic nanoelectrodes precisely in the plasmonic hot spots, making this kind of investigation possible. After electroporation, the cell membrane dynamics are studied by recording the Raman time traces of biomolecules in contact or next to the 3D plasmonic nanoelectrode. During this process, the 3D plasmonic nanoelectrodes are intracellularly coupled, thus enabling the monitoring of different molecular species, including lipids, proteins, and nucleic acids. Scanning electron microscopy cross-section analysis evidences the possibility of nuclear membrane poration compatible with the reported Raman spectra. These findings may open a new route toward controlled intracellular sampling and intranuclear delivery of genic materials. They also show the possibility of nuclear envelope disruption which may lead to negative side effects.

Keywords: Raman spectroscopy; electroporation; intracellular spectroscopy; microelectrode arrays; nanopillars; permeabilization.


Figures

Figure 1
Figure 1
Sketch of the system with inset showing the magnification at the 3D nanostructure tip. On top of the 3D nanostructures (yellow), cells (in orange) were tightly sealed to the substrate. The plasmonic modes of the 3D nanoelectrode were excited by a 785 nm laser, and the enhanced Raman signals coming from the molecules close to it were collected. The different colors of the substrate represent bulk quartz (salmon), gold nanoelectrode (yellow), and an SU8 passivation layer (green).
Figure 2
Figure 2
a) SEM image of a single 3D plasmonic nanoelectrode embedded in the SU8 passivation layer. b,c) Magnification of six 3D nanofabricated flat electrodes and the entire MEA‐like device, respectively. e) Tilted SEM image of a fixed and resin‐infiltrated NIH‐3T3 cell cultured on the 3D plasmonic nanoelectrodes. In correspondence with the dotted line, g) the SEM image of the FIB cross section with inverted colors reveals the cell interface with the 3D plasmonic nanoelectrodes. The SU8 passivated flat substrate that is clearly visible (in white, below the cell). d) Inset of the cross section in which the 3D plasmonic nanoelectrode is close to the nuclear envelope (indicated with the starred arrow), and the cell membrane is in tight adhesion with the device (arrows without star). f) Inset of the cross section that shows the plasma membrane tightly wrapped all around the 3D plasmonic nanoelectrode (arrows) and to the flat SU8 passivation layer.
Figure 3
Figure 3
a) Enhanced Raman spectra recorded from the same 3D plasmonic nanoelectrode before (black), 2 min after (red), and 20 min after (blue) the application of the electroporation pulse train. Three regions of the Raman shift are highlighted in which most of the peaks are related to lipids and proteins. The background has been subtracted and the intensities coherently shifted to improve the visualization. Data are from a single experiment. b,c) Colored maps of the average SERS signals of cells lying on top of 3D plasmonic nanoelectrodes excited by a λ = 785 nm laser during 30 min of acquisition. b) The spectra do not show particular features or changes in time when there are no external stimuli applied. c) Average SERS signals of electroporated samples at 10 min from the beginning of the experiments. After electroporation (at t = 600 s, marked by the dotted line), new vibrational modes appear, and the average peaks intensities increase. Rapid shifts of new and old peaks occur, meaning that the plasma membrane and the rest of the cell undergo rearrangement. Slowly over time, the signals come back to resemble the signal before the electroporation occurred.
Figure 4
Figure 4
a–d) Average temporal behaviors of lipid related peaks throughout the 30 min of experiments in the absence (black) and in the presence (pink) of the electroporation, which is identified by the dotted line. The peak dynamics are shown on the average spectra. In particular, the dynamics of the a) 954 cm−1 peak assigned to cholesterol, b) 975 cm−1 peak assigned to fatty acid, c) 875 cm−1 peak assigned to the C—C stretching of phospholipids, and d) 1464 cm−1 peak assigned to CH2\CH3 deformations in cholesterol and triacylglycerols. e) Highlighted peaks from the global colored map of electroporated samples. Scale bar from 0 a.u. (black) to 5000 a.u. (red). f) Sketches of possible lipid membrane configurations. Top left: intact lipid bilayer, top right and bottom left: hydrophobic pores in the cell membrane, bottom right: hydrophilic pore.
Figure 5
Figure 5
Average temporal behaviors of protein‐related peaks throughout the 30 min of experiments in the absence (black) and in the presence (purple) of electroporation, identified by the dotted line. The peak dynamics are shown on the average spectra. In particular, dynamics of the a) 830 cm−1 peak, associated with the tyrosine amino acid, b) 1002 cm−1 peak assigned to phenylalanine, c) 1302 cm−1 peak that identifies the amide III vibrational mode, d) 1545 cm−1 peak assigned to the amide II vibrational mode, and e) 1552 cm−1 peak, assigned to the tryptophan amino acid. f) Highlighted peaks from the colored average map. Scale bar from 0 a.u. (black) to 5000 a.u. (red).
Figure 6
Figure 6
Average dynamic behavior in time of DNA‐ and nucleic acid‐associated peaks. a) 790 cm−1 peak associated with the O—P—O stretching of DNA and RNA backbone, b) vibrational mode assigned to nucleic acid at 1120 cm−1, c) peak centered at 1252 cm−1 associated with vibration of cytosine and guanine, and d) peak at 1573 cm−1 related to guanine and adenine vibrational modes. Red spectra are the average of electroporated samples at 600 s (dotted line), while black spectra are the reference to which electroporation has not been applied. e) Highlighted peaks from the global colored map that indicated electroporation. Scale bar from 0 a.u. (black) to 5000 a.u. (red). f) SEM cross section (with inverted colors) of a 3D plasmonic nanoelectrode tip with a cell grown on it. The sample was fixed and analyzed after the application of electroporation. The starred arrows indicate the nuclear envelop, clearly broken close to the edge of the 3D nanostructure. The arrows without the star indicate the plasma membrane.

Similar articles

Cited by

  • Resonant Enhancement of Polymer-Cell Optostimulation by a Plasmonic Metasurface.
    Maity A, Perotto S, Moschetta M, Hua H, Sardar S, Paternò GM, Tian J, Klein M, Adamo G, Lanzani G, Soci C. Maity A, et al. ACS Omega. 2022 Nov 16;7(47):42674-42680. doi: 10.1021/acsomega.2c04812. eCollection 2022 Nov 29. ACS Omega. 2022. PMID: 36467911 Free PMC article. Review.
  • High-Aspect-Ratio Nanostructured Surfaces as Biological Metamaterials.
    Higgins SG, Becce M, Belessiotis-Richards A, Seong H, Sero JE, Stevens MM. Higgins SG, et al. Adv Mater. 2020 Mar;32(9):e1903862. doi: 10.1002/adma.201903862. Epub 2020 Jan 16. Adv Mater. 2020. PMID: 31944430 Free PMC article. Review.
  • Plasmonic Metasurface for Spatially Resolved Optical Sensing in Three Dimensions.
    Nugroho FAA, Albinsson D, Antosiewicz TJ, Langhammer C. Nugroho FAA, et al. ACS Nano. 2020 Feb 25;14(2):2345-2353. doi: 10.1021/acsnano.9b09508. Epub 2020 Feb 3. ACS Nano. 2020. PMID: 31986008 Free PMC article.
  • Cellular nanointerface of vertical nanostructure arrays and its applications.
    Zhang A, Fang J, Li X, Wang J, Chen M, Chen HJ, He G, Xie X. Zhang A, et al. Nanoscale Adv. 2022 Feb 21;4(8):1844-1867. doi: 10.1039/d1na00775k. eCollection 2022 Apr 12. Nanoscale Adv. 2022. PMID: 36133409 Free PMC article. Review.
  • Present and Future of Surface-Enhanced Raman Scattering.
    Langer J, Jimenez de Aberasturi D, Aizpurua J, Alvarez-Puebla RA, Auguié B, Baumberg JJ, Bazan GC, Bell SEJ, Boisen A, Brolo AG, Choo J, Cialla-May D, Deckert V, Fabris L, Faulds K, García de Abajo FJ, Goodacre R, Graham D, Haes AJ, Haynes CL, Huck C, Itoh T, Käll M, Kneipp J, Kotov NA, Kuang H, Le Ru EC, Lee HK, Li JF, Ling XY, Maier SA, Mayerhöfer T, Moskovits M, Murakoshi K, Nam JM, Nie S, Ozaki Y, Pastoriza-Santos I, Perez-Juste J, Popp J, Pucci A, Reich S, Ren B, Schatz GC, Shegai T, Schlücker S, Tay LL, Thomas KG, Tian ZQ, Van Duyne RP, Vo-Dinh T, Wang Y, Willets KA, Xu C, Xu H, Xu Y, Yamamoto YS, Zhao B, Liz-Marzán LM. Langer J, et al. ACS Nano. 2020 Jan 28;14(1):28-117. doi: 10.1021/acsnano.9b04224. Epub 2019 Oct 8. ACS Nano. 2020. PMID: 31478375 Free PMC article.

References

    1. Sezgin E., Levental I., Mayor S., Eggeling C., Nat. Rev. Mol. Cell Biol. 2017, 18, 361. - PMC - PubMed
    1. Stewart M. P., Sharei A., Ding X., Sahay G., Langer R., Jensen K. F., Nature 2016, 538, 183. - PubMed
    1. Duan X., Gao R., Xie P., Cohen‐Karni T., Qing Q., Choe H. S., Tian B., Jiang X., Lieber C. M., Nat. Nanotechnol. 2012, 7, 174. - PMC - PubMed
    1. Potter H., Weir L., Leder P., Proc. Natl. Acad. Sci. USA 1984, 81, 7161. - PMC - PubMed
    1. Chen C., Smye S. W., Robinson M. P., Evans J. A., Med. Biol. Eng. Comput. 2006, 44, 5. - PubMed