

Label-Free High-Throughput Leukemia Detection by Holographic Microscopy
- PMID: 30581697
- PMCID: PMC6299719
- DOI: 10.1002/advs.201800761
Label-Free High-Throughput Leukemia Detection by Holographic Microscopy
Abstract
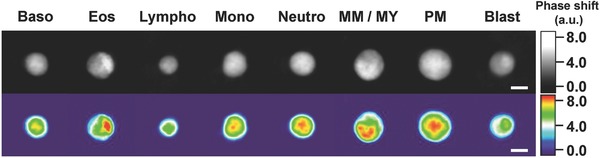
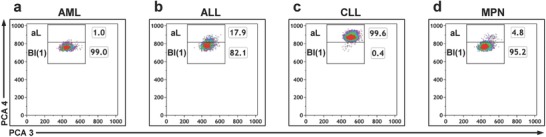
Complete blood count and differentiation of leukocytes (DIFF) belong to the most frequently performed laboratory diagnostic tests. Here, a flow cytometry-based method for label-free DIFF of untouched leukocytes by digital holographic microscopy on the rich phase contrast of peripheral leukocyte images, using highly controlled 2D hydrodynamic focusing conditions is reported. Principal component analysis of morphological characteristics of the reconstructed images allows classification of nine leukocyte types, in addition to different types of leukemia and demonstrates disappearance of acute myeloid leukemia cells in remission. To exclude confounding effects, the classification strategy is tested by the analysis of 20 blinded clinical samples. Here, 70% of the specimens are correctly classified with further 20% classifications close to a correct diagnosis. Taken together, the findings indicate a broad clinical applicability of the cytometry method for automated and reagent-free diagnosis of hematological disorders.
Keywords: digital holographic microscopy; label‐free detection; leukemia; microfluidics.
Figures


Similar articles
-
Quantitative phase imaging of cells in a flow cytometry arrangement utilizing Michelson interferometer-based off-axis digital holographic microscopy.J Biophotonics. 2019 Sep;12(9):e201900085. doi: 10.1002/jbio.201900085. Epub 2019 Jun 20. J Biophotonics. 2019. PMID: 31169960
-
Digital Holographic Microscopy for Label-Free Detection of Leukocyte Alternations Associated with Perioperative Inflammation after Cardiac Surgery.Cells. 2022 Feb 21;11(4):755. doi: 10.3390/cells11040755. Cells. 2022. PMID: 35203403 Free PMC article.
-
Real-Time Stain-Free Classification of Cancer Cells and Blood Cells Using Interferometric Phase Microscopy and Machine Learning.Cytometry A. 2021 May;99(5):511-523. doi: 10.1002/cyto.a.24227. Epub 2020 Oct 13. Cytometry A. 2021. PMID: 32910546
-
[Further evolution and leukocyte differential using an automated blood cell counter].Rinsho Byori. 1995 Sep;43(9):925-30. Rinsho Byori. 1995. PMID: 7474456 Review. Japanese.
-
Peripheral blood film review. The demise of the eyecount leukocyte differential.Clin Lab Med. 2002 Mar;22(1):279-97. doi: 10.1016/s0272-2712(03)00075-1. Clin Lab Med. 2002. PMID: 11933579 Review.
Cited by
-
Optical Investigation of Individual Red Blood Cells for Determining Cell Count and Cellular Hemoglobin Concentration in a Microfluidic Channel.Micromachines (Basel). 2021 Mar 26;12(4):358. doi: 10.3390/mi12040358. Micromachines (Basel). 2021. PMID: 33810262 Free PMC article.
-
Phenotyping neuroblastoma cells through intelligent scrutiny of stain-free biomarkers in holographic flow cytometry.APL Bioeng. 2023 Sep 21;7(3):036118. doi: 10.1063/5.0159399. eCollection 2023 Sep. APL Bioeng. 2023. PMID: 37753527 Free PMC article.
-
Cellular lensing and near infrared fluorescent nanosensor arrays to enable chemical efflux cytometry.Nat Commun. 2021 May 25;12(1):3079. doi: 10.1038/s41467-021-23416-1. Nat Commun. 2021. PMID: 34035262 Free PMC article.
-
Label-Free Leukemia Monitoring by Computer Vision.Cytometry A. 2020 Apr;97(4):407-414. doi: 10.1002/cyto.a.23987. Epub 2020 Feb 24. Cytometry A. 2020. PMID: 32091180 Free PMC article.
-
Deepometry, a framework for applying supervised and weakly supervised deep learning to imaging cytometry.Nat Protoc. 2021 Jul;16(7):3572-3595. doi: 10.1038/s41596-021-00549-7. Epub 2021 Jun 18. Nat Protoc. 2021. PMID: 34145434 Free PMC article.
References
LinkOut - more resources
Full Text Sources
Other Literature Sources