. 2018 Oct 31;5(12):1801158.
doi: 10.1002/advs.201801158. eCollection 2018 Dec.

Single-Cell Mobility Analysis of Metastatic Breast Cancer Cells

Affiliations

Single-Cell Mobility Analysis of Metastatic Breast Cancer Cells

Jialang Zhuang et al. Adv Sci (Weinh). .

Abstract

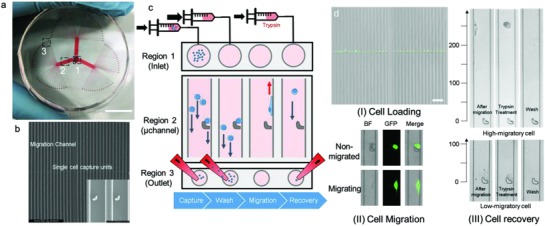
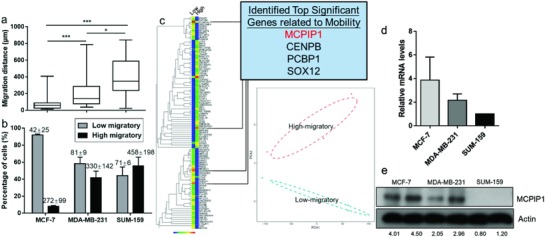
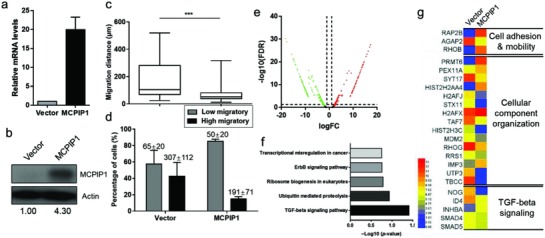
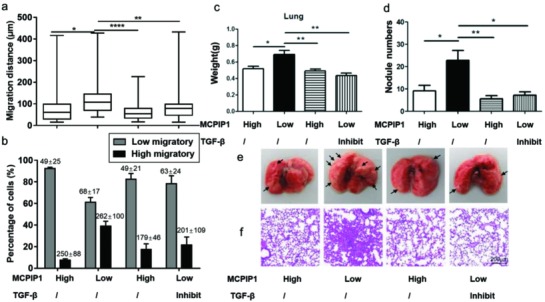
Efforts have been taken to enhance the study of single-cells, however, the task remains challenging because most previous investigations cannot exclude the interactions between single cells or separately retrieved cells with specificity for further analyses. Here, a single-cell mobility analysis platform (SCM-Chip) is developed that can not only real-time monitor single-cell migration in independent niches but can also selectively recover target cells one by one. The design of each channel with a single-cell capture unit and an outlet enables the system to place single cells in different isolated niches with fluidic capture and to respectively collect target cells based on mobilities. SCM-Chip characterization of breast cancer cells reveals the presence of high- and low-migratory populations. Whole-cell transcriptome analysis establishes that monocyte chemotactic protein induced protein 1 (MCPIP1) is related with cell mobility; cells with a high expression of MCPIP1 exhibit low mobility in vitro and metastasis in vivo. The SCM platform provides a generic tool for accurate single-cell isolation and differentiation that can be readily adapted for the study of cancer and drug development.

Keywords: MCPIP1; cell migration; metastasis; microfluidic; single‐cell anlalysis.


Figures

Figure 1
Figure 1
Working principle of the SCM‐Chip. a) Photograph of SCM‐Chip indicating the inlet. Scale bar: 15 mm (Region 1), one of the three multi‐microchannel branches (Region 2), and different isolated outlets (Region 3). b) SEM of the chip with higher magnification of microchannel and magnified hooks for single‐cell capture. Scale bars: 500 and 50 µm. c) Work flow for single‐cell mobility array using SCM‐Chip, including single‐cell capture, cell washing, single‐cell migration, and specific cell recovery. d) Characterization of MDA‐MB‐231 cell loading (I), scale bar, 200 µm, single‐cell migration (II), and functional retrieval on‐chip (III).
Figure 2
Figure 2
Increased MCPIP1 expression among low‐migratory cells. a) Comparison of the migration distances and percentage of high‐migratory versus low‐migratory cells (mean ± SD is shown in corresponding bar plots to represent the results) b) for MCF‐7, MDA‐MB‐231, and SUM‐159 cells. c) Left: Comprehensive heat map showing the expression levels of genes between high‐migratory and low‐migratory cells. Right: Row corresponding to the top 265 different expressed genes across these two subpopulations (upper panel). Principal‐component analysis (PCA) of the transcriptome of high‐migratory and low‐migratory cells sorted by SCM‐Chip from MDA‐MB‐231. Cells from the same group are shown as symbols of the same color. PCA1 and PCA2 represent the top two dimensions of the genes showing all expression among cells with different mobility, which accounts for 55.1% and 18.1% (lower panel). d) qRT‐PCR analysis of MCPIP1 mRNA level in MCF‐7, MDA‐MB‐231, and SUM‐159 cells. e) Western‐blot analysis of MCPIP1 protein level in MCF‐7, MDA‐MB‐231, and SUM‐159 cells.
Figure 3
Figure 3
MCPIP1 reduces single‐cell migration and suppresses TGF‐β signaling. a) qRT‐PCR analysis of MCPIP1 mRNA level in MDA‐MB‐231/Vector and MDA‐MB‐231/MCPIP1 cells. b) Western‐blot analysis of MCPIP1 protein level in MDA‐MB‐231/Vector and MDA‐MB‐231/MCPIP1 cells. Comparison of the migration distances. c) Percentage of high‐migratory versus low‐migratory cells (mean ± SD is shown in corresponding bar plots to represent the results). d) For MDA‐MB‐231/Vector and MDA‐MB‐231/MCPIP1 cells. e) Volcano plot of differentially expressed gene between MDA‐MB‐231/Vector and MDA‐MB‐231/MCPIP1 cells. The red dots represent up‐regulation genes and the green dots represent down‐regulation genes. f) Enriched KEGG pathways in gene correlation among MCPIP1 overexpression cells. g) Heat map for mRNA related to cell migration and TGF‐β signaling between MDA‐MB‐231/Vector and MDA‐MB‐231/MCPIP1 cells.
Figure 4
Figure 4
Inhibition of the TGF‐β pathway restores the MCPIP1‐dependent cell migration. a) Comparison of the migration distances and percentage of high‐migratory versus low‐migratory cells (mean ± SD is shown in corresponding bar plots to represent the results) b) for MCF‐7/Vector, MDA‐MB‐231/Vector, MDA‐MB‐231/MCPIP1, and SB431542 (10 × 10−6 m) pretreated MDA‐MB‐231/Vector cells. c) Quantification of the lung weight and d) the number of nodules on lungs of BALB/c nude mice. Representative images of e) lungs and f) haematoxylin and eosin staining of lung sections from BALB/c nude mice, scale bars, 200 µm.

References

    1. Siegel R. L., Miller K. D., Jemal A., Ca‐Cancer J. Clin. 2018, 68, 1. - PubMed
    1. Friedl P., Gilmour D., Nat. Rev. Mol. Cell Biol. 2009, 10, 445. - PubMed
    1. Celia‐Terrassa T., Kang Y., Genes Dev. 2016, 30, 892. - PMC - PubMed
    1. Palumbo A. J., Da C. N. O., Bonamino M. H., Pinto L. F., Nasciutti L. E., Mol. Cancer 2015, 14, 145. - PMC - PubMed
    1. Pikor L., Thu K., Vucic E., Lam W., Cancer Metastasis Rev. 2013, 32, 341. - PMC - PubMed

LinkOut - more resources