

Personalized Nanotherapy by Specifically Targeting Cell Organelles To Improve Vascular Hypertension
- PMID: 30582331
- PMCID: PMC7899193
- DOI: 10.1021/acs.nanolett.8b04138
Personalized Nanotherapy by Specifically Targeting Cell Organelles To Improve Vascular Hypertension
Abstract
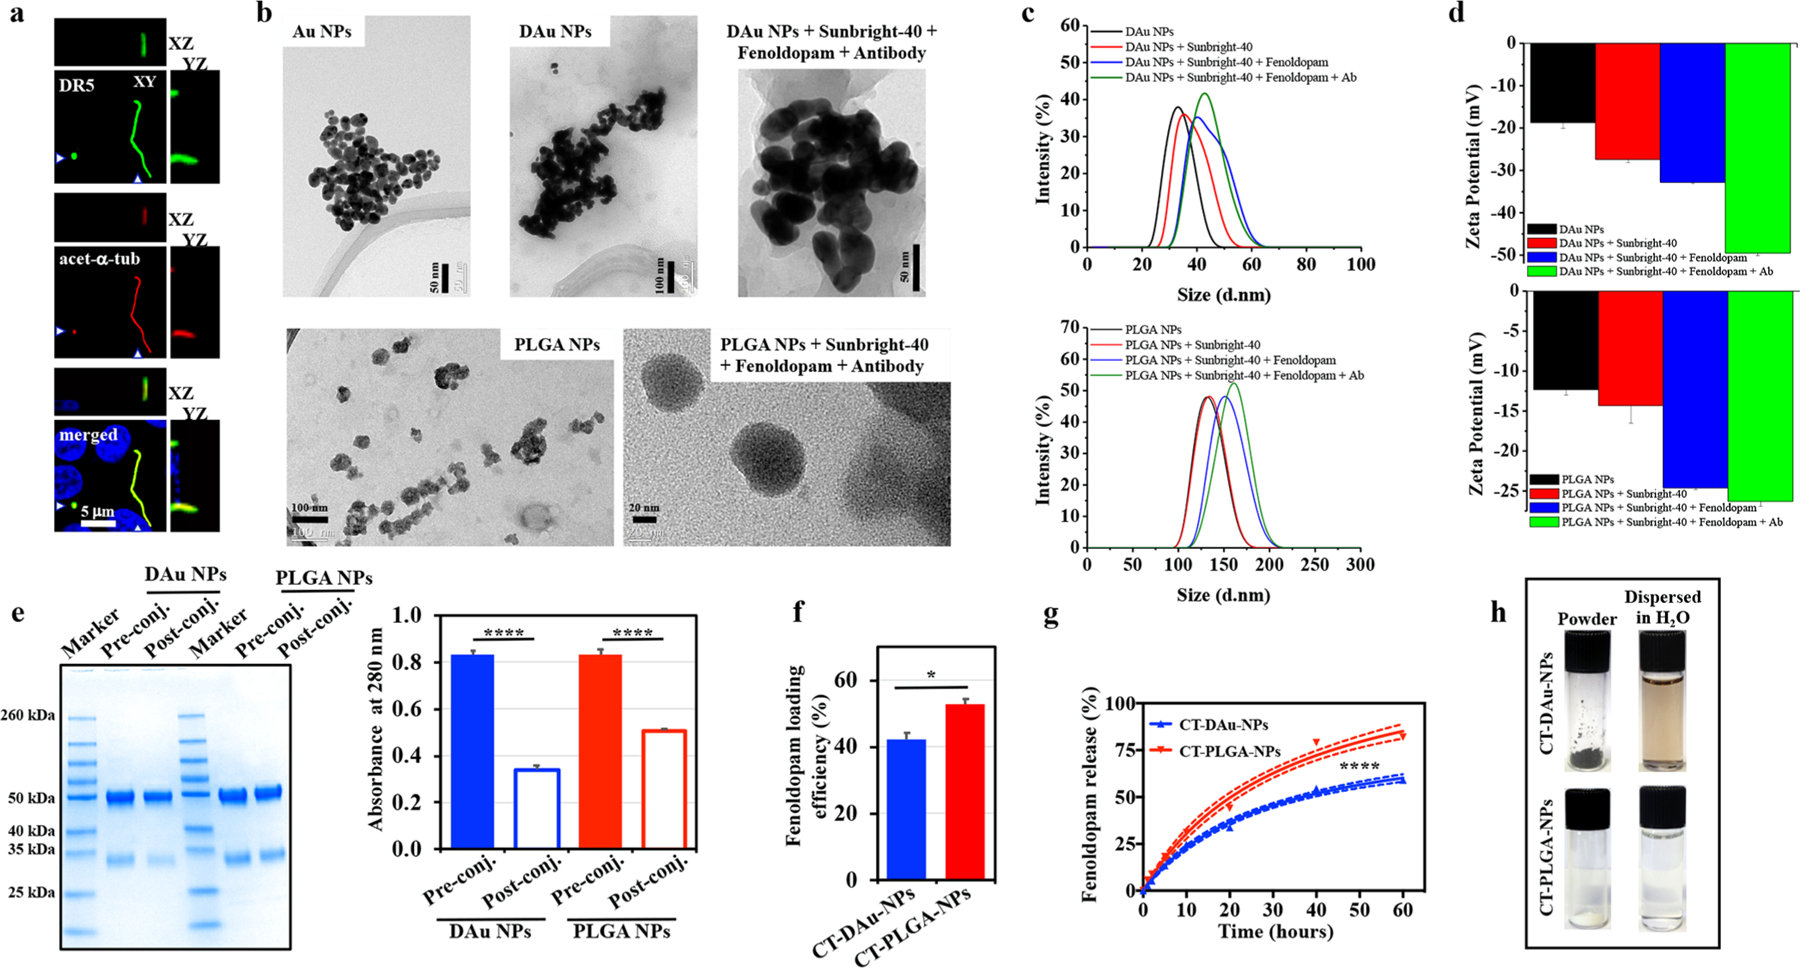
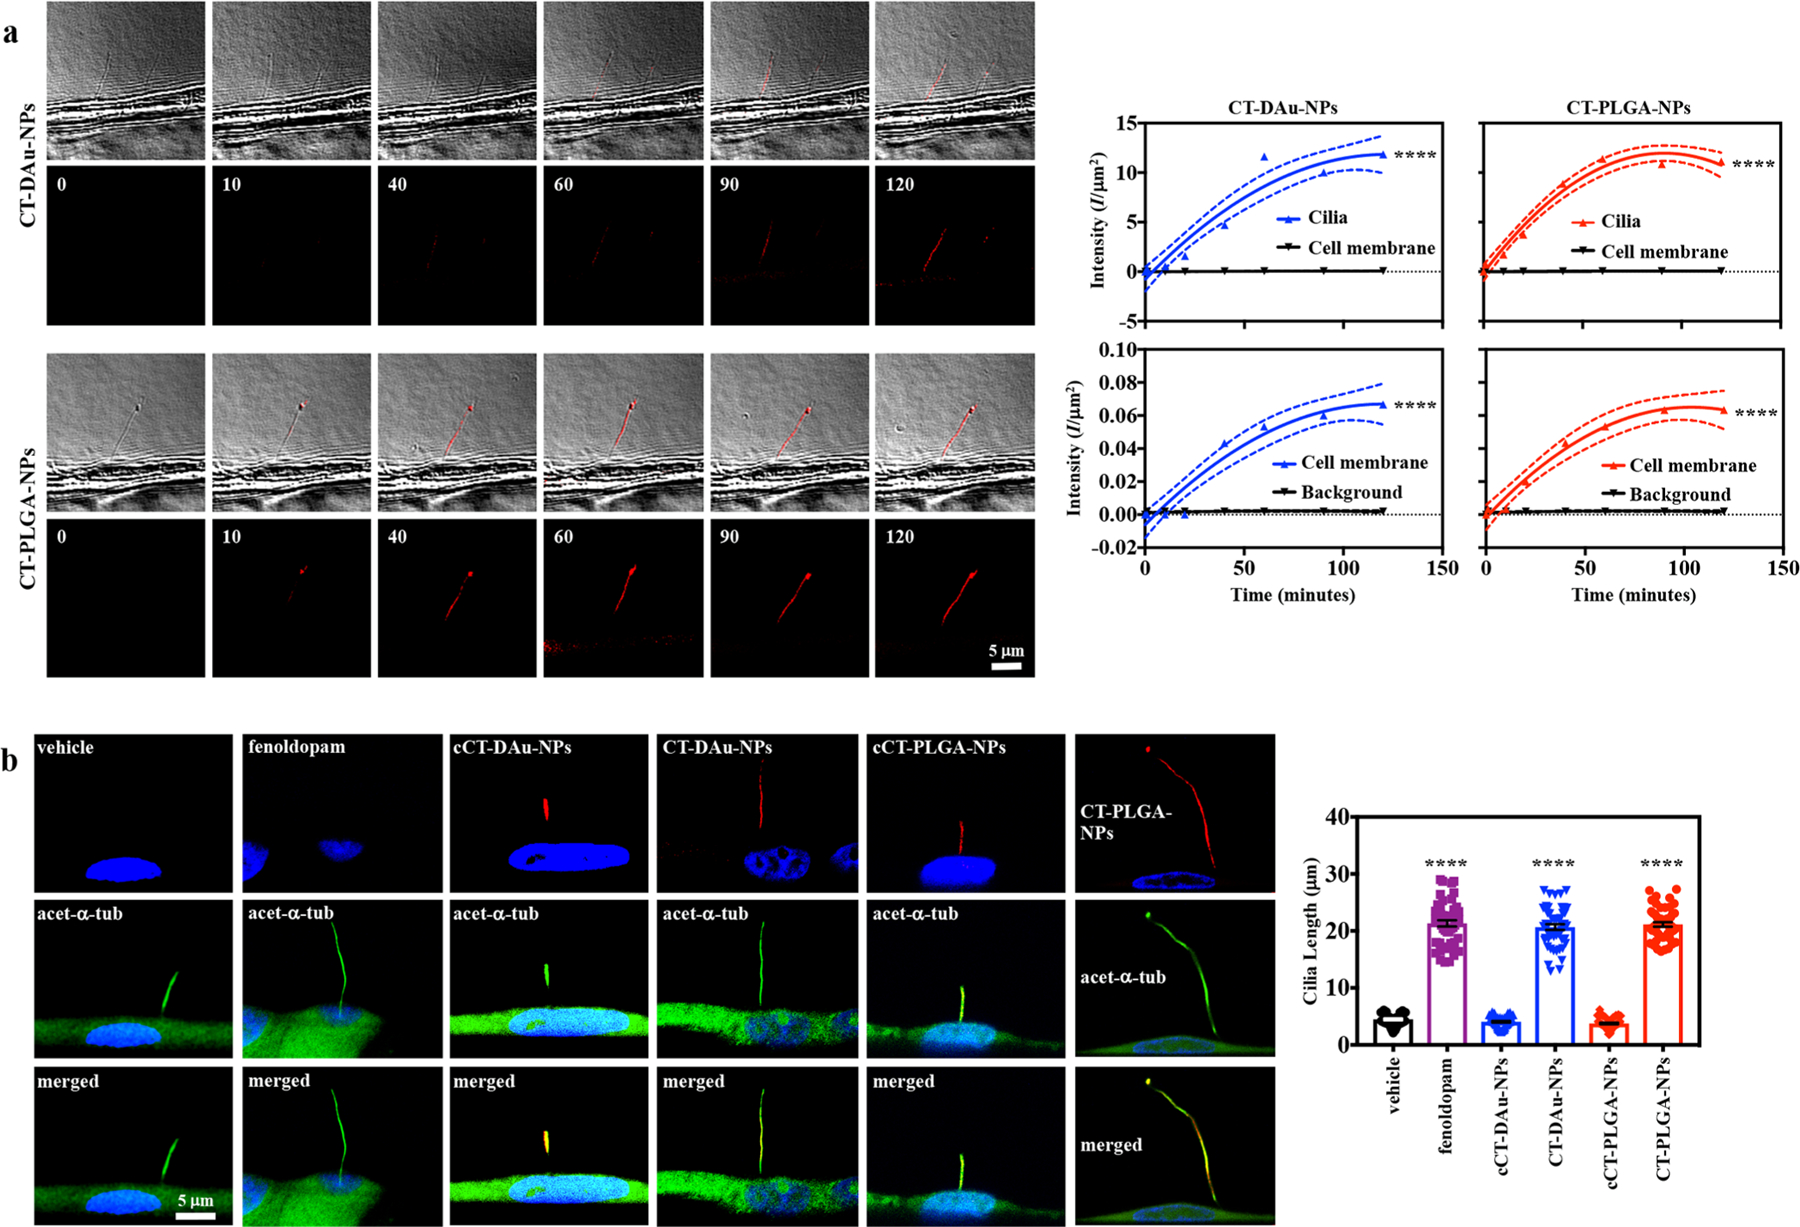
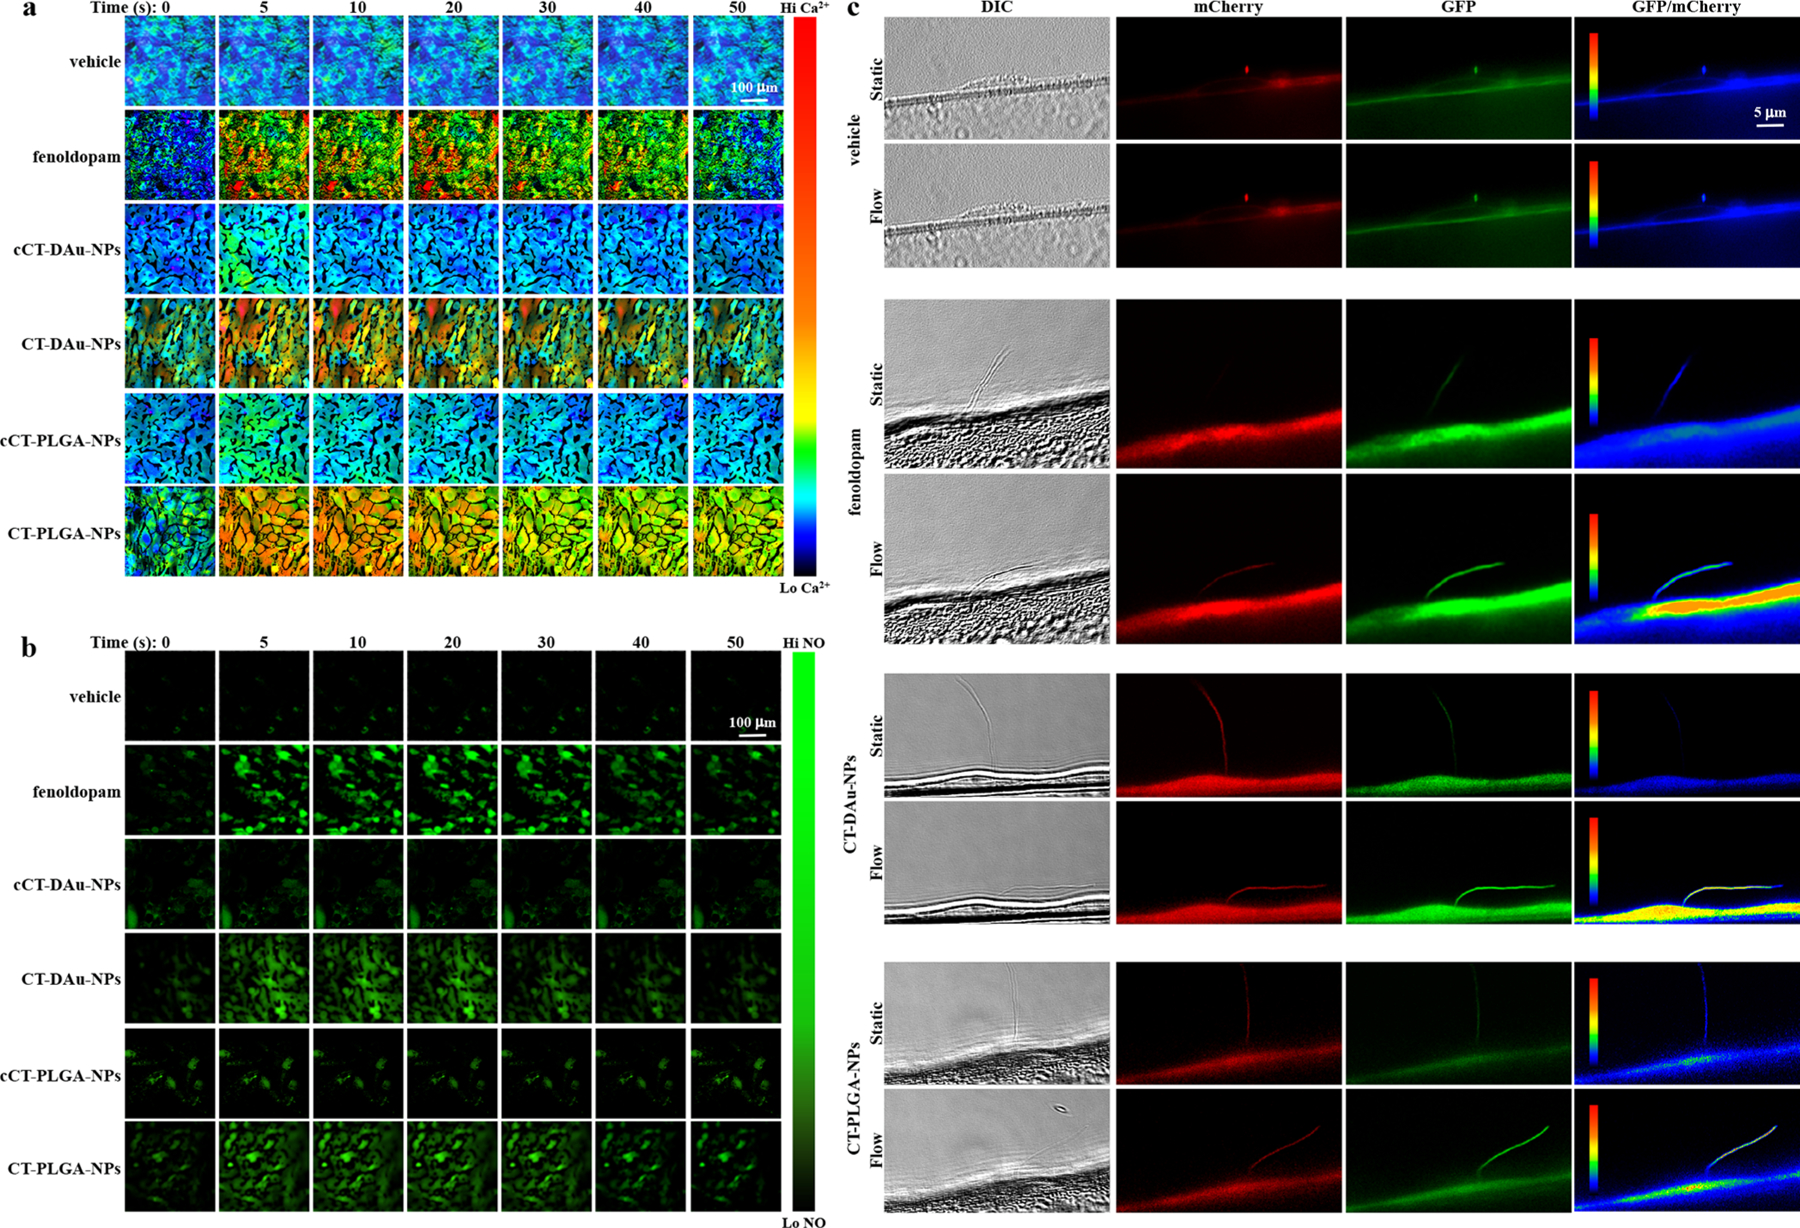
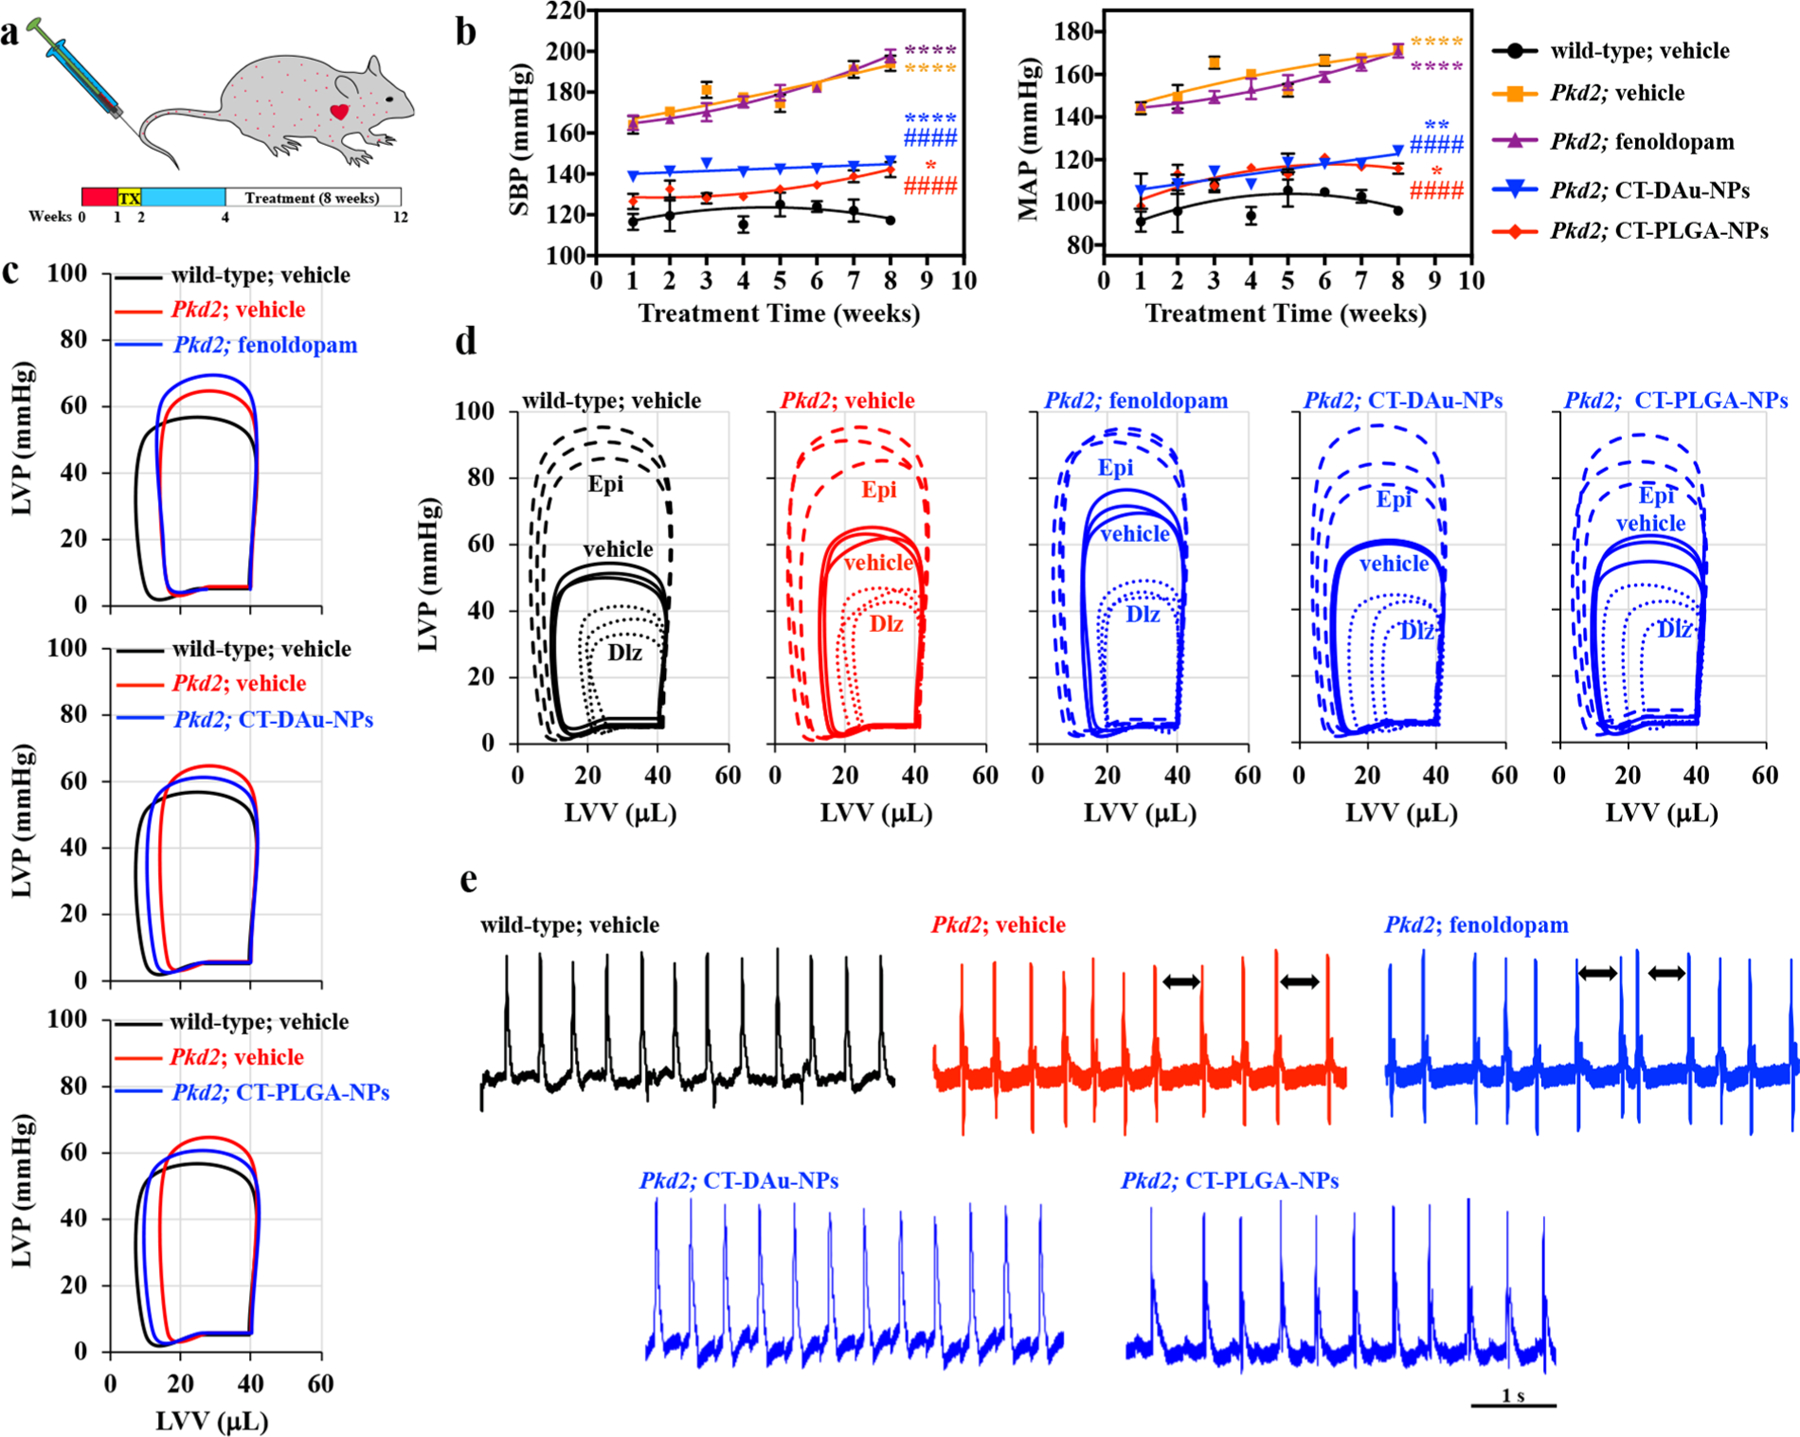
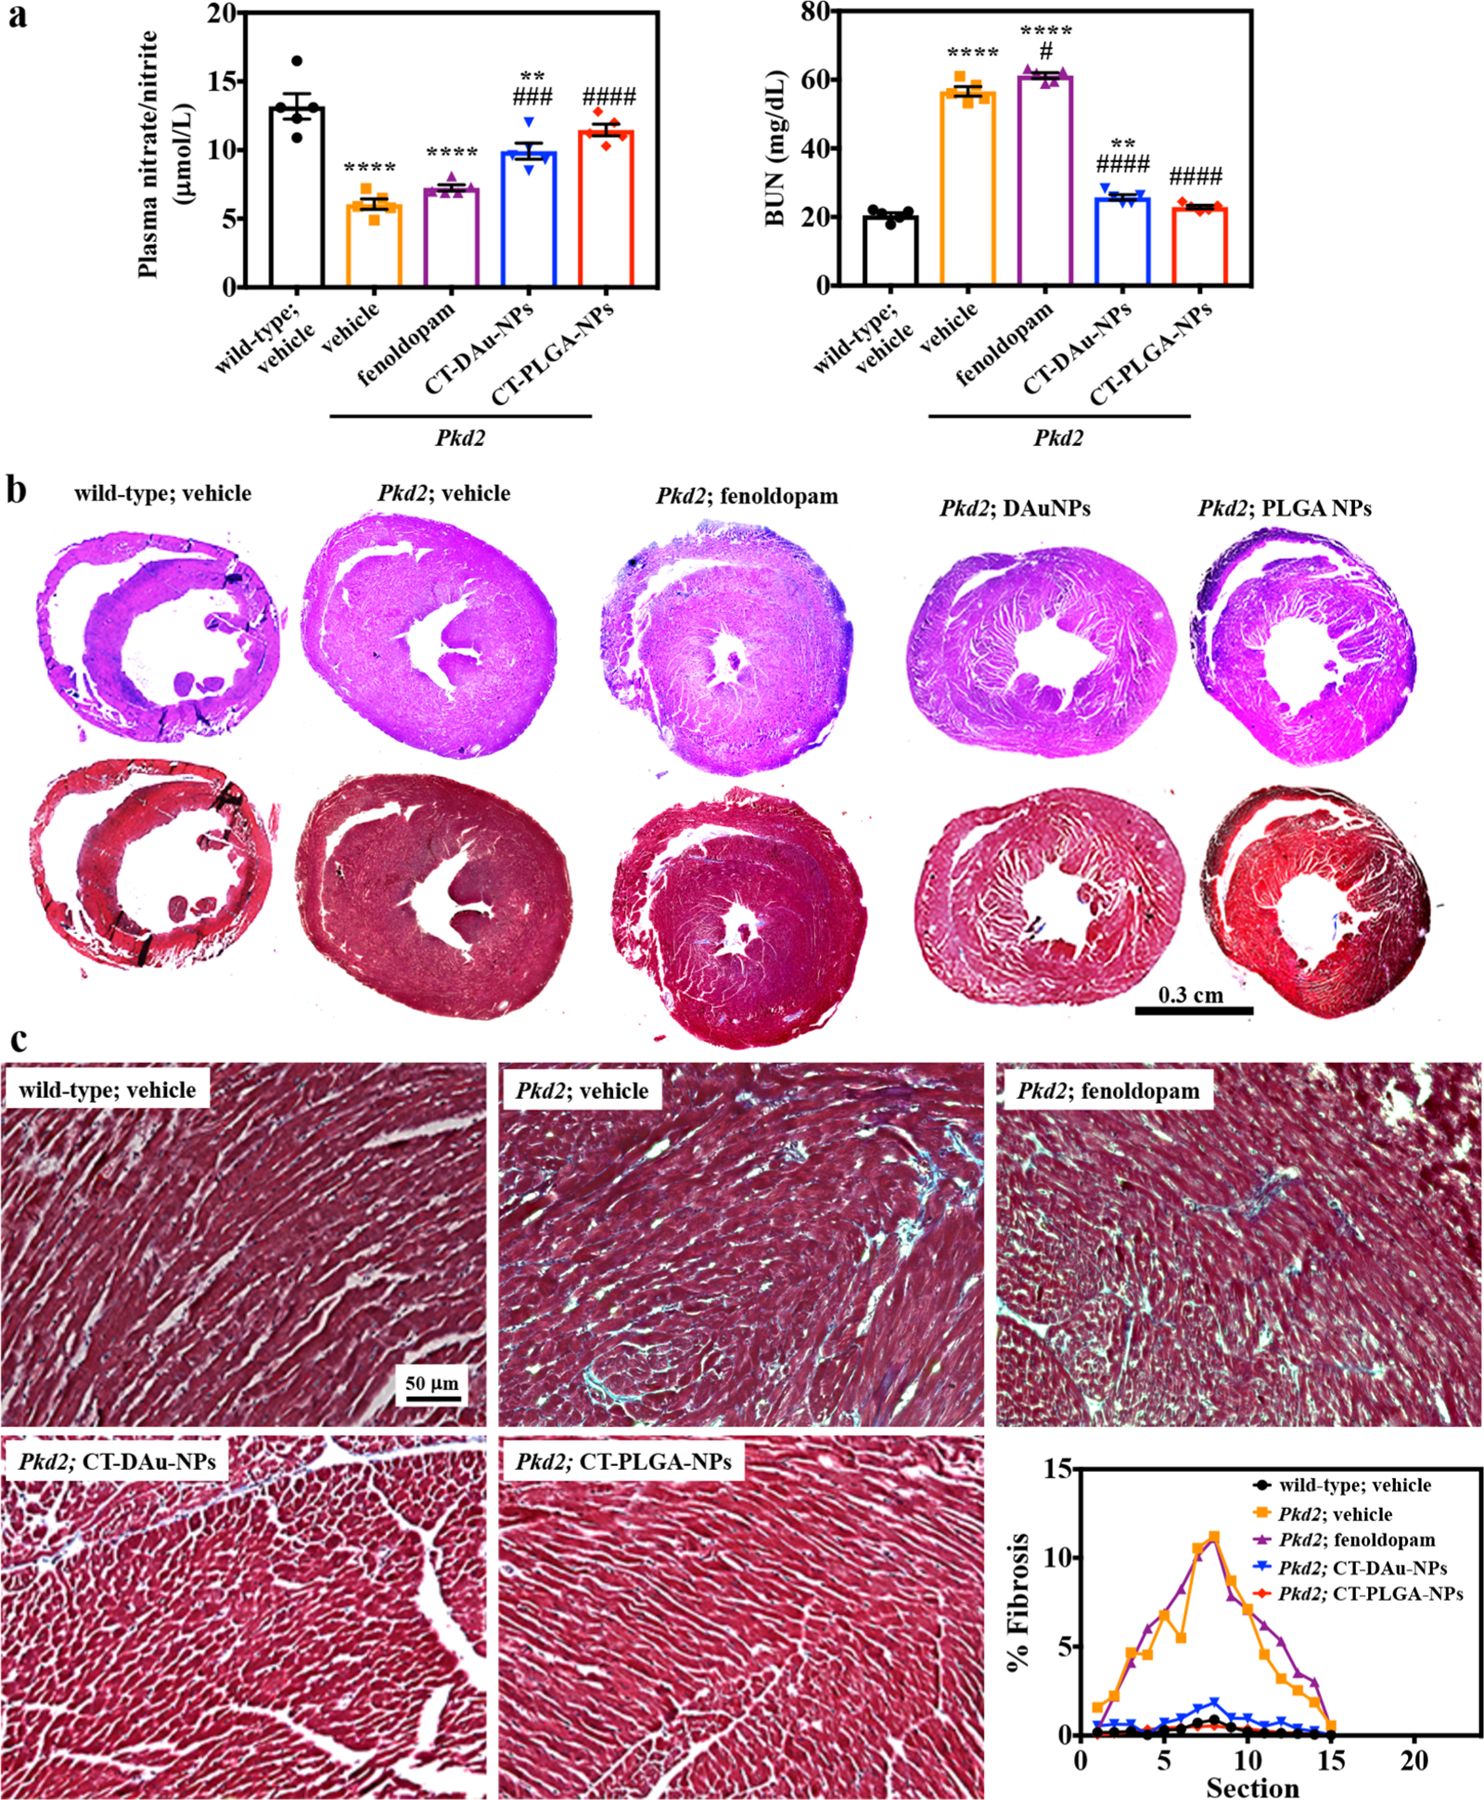
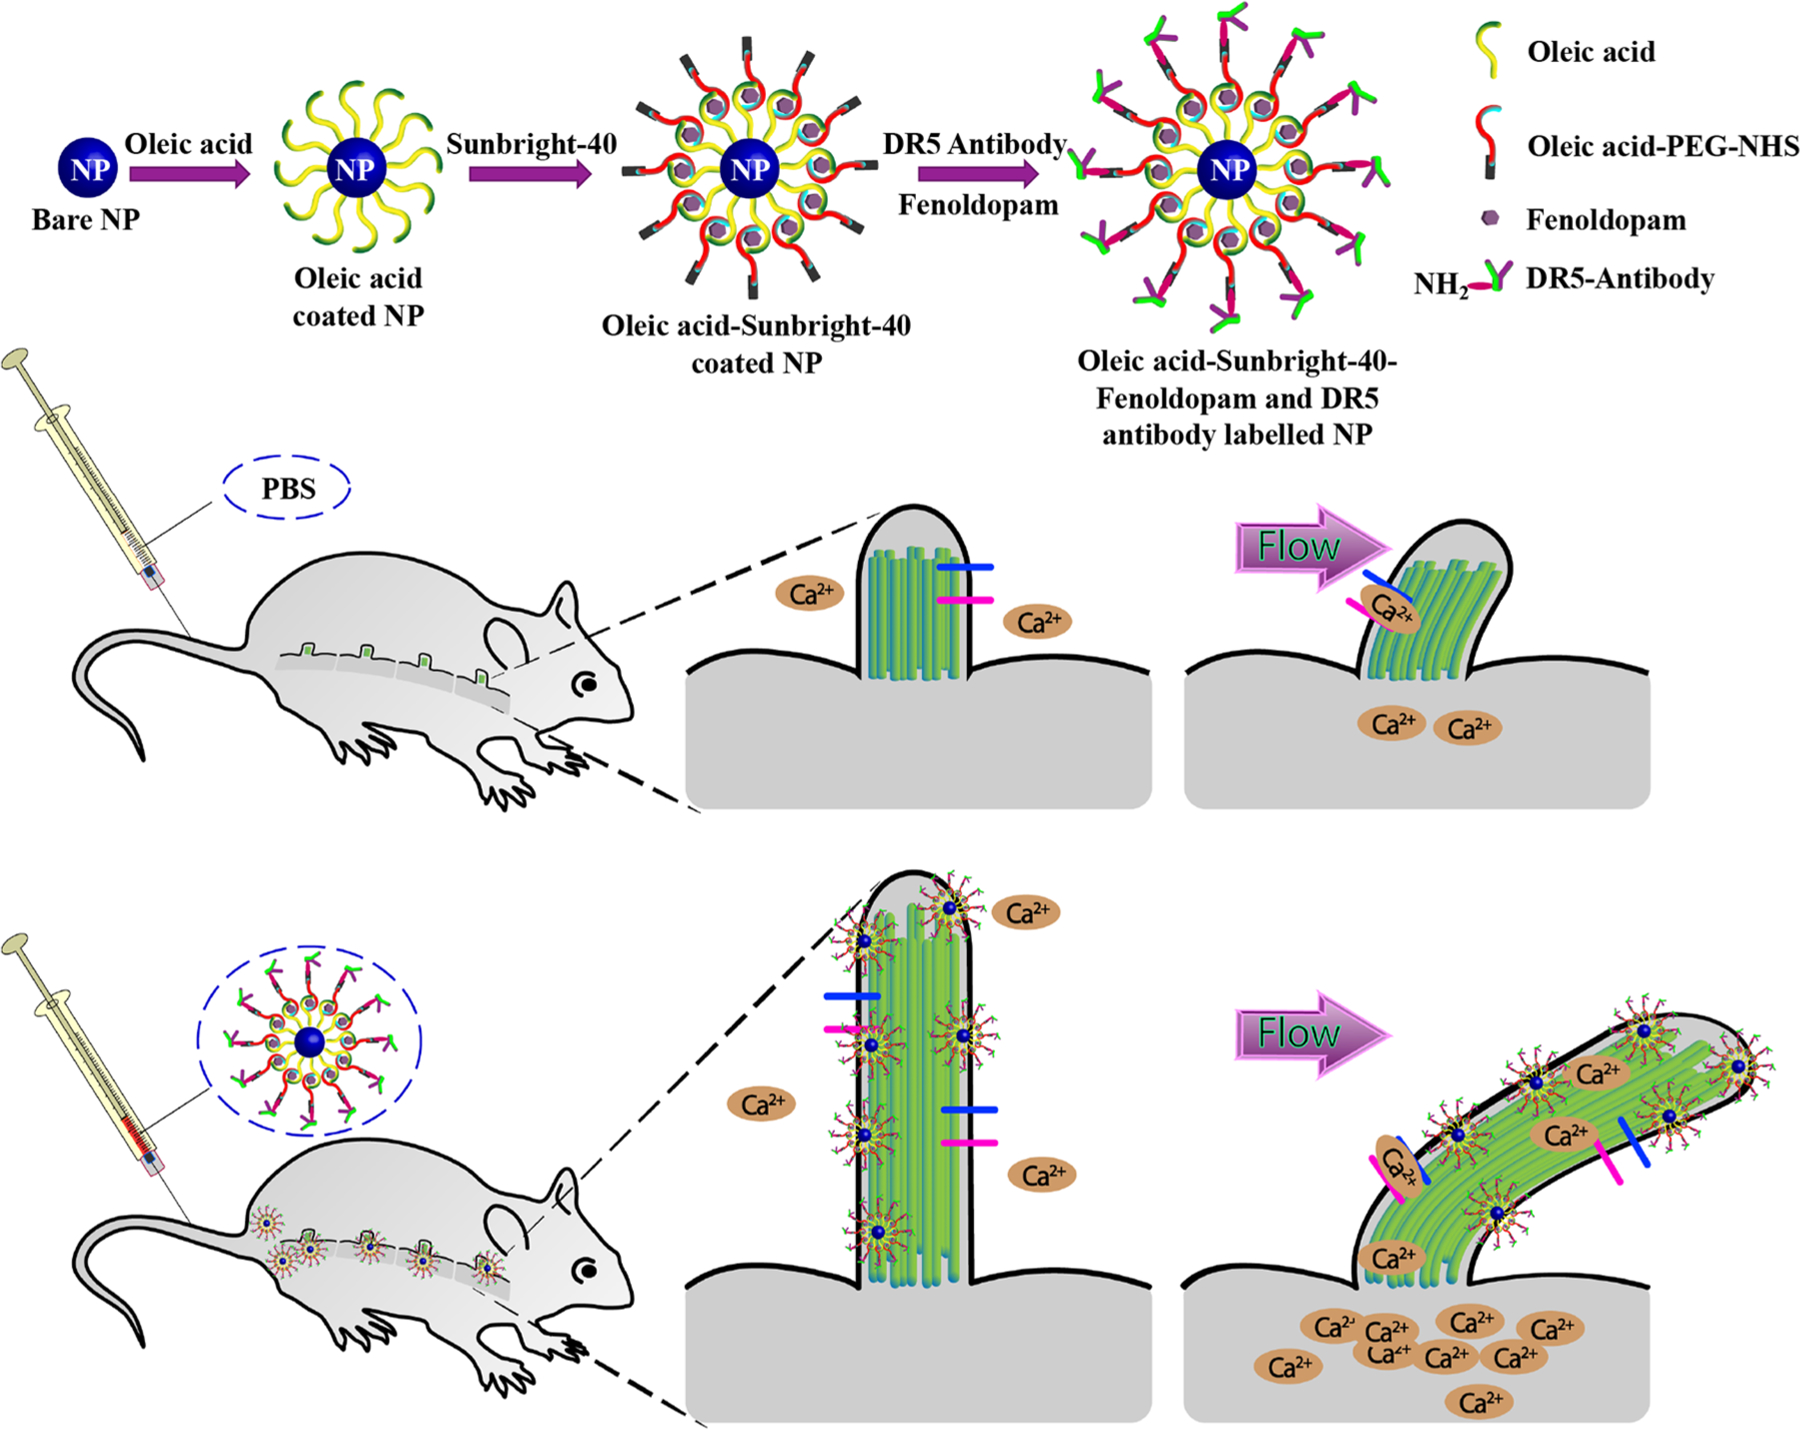
Ciliopathies caused by abnormal function of primary cilia include expanding spectrum of kidney, liver, and cardiovascular disorders. There is currently no treatment available for patients with cilia dysfunction. Therefore, we generated and compared two different (metal and polymer) cilia-targeted nanoparticle drug delivery systems (CTNDDS), CT-DAu-NPs and CT-PLGA-NPs, for the first time. These CTNDDS loaded with fenoldopam were further compared to fenoldopam-alone. Live-imaging of single-cell-single-cilium analysis confirmed that CTNDDS specifically targeted to primary cilia. While CTNDDS did not show any advantages over fenoldopam-alone in cultured cells in vitro, CTNDDS delivered fenoldopam more superior than fenoldopam-alone by eliminating the side effect of reflex tachycardia in murine models. Although slow infusion was required for fenoldopam-alone in mice, bolus injection was possible for CTNDDS. Though there were no significant therapeutic differences between CT-DAu-NPs and CT-PLGA-NPs, CT-PLGA-NPs tended to correct ciliopathy parameters closer to normal physiological levels, indicating CT-PLGA-NPs were better cargos than CT-DAu-NPs. Both CTNDDS showed no systemic adverse effect. In summary, our studies provided scientific evidence that existing pharmacological agent could be personalized with advanced nanomaterials to treat ciliopathy by targeting cilia without the need of generating new drugs.
Keywords: Cilia targeting; calcium; drug delivery; hypertension; nanoparticles; nitric oxide.
Conflict of interest statement
The authors declare no competing financial interest.
Figures
Similar articles
-
Ciliotherapy: Remote Control of Primary Cilia Movement and Function by Magnetic Nanoparticles.ACS Nano. 2019 Mar 26;13(3):3555-3572. doi: 10.1021/acsnano.9b00033. Epub 2019 Mar 15. ACS Nano. 2019. PMID: 30860808 Free PMC article.
-
Fenoldopam: a new parenteral antihypertensive: consensus roundtable on the management of perioperative hypertension and hypertensive crises.Am J Hypertens. 1999 Jul;12(7):653-64. doi: 10.1016/s0895-7061(99)00059-x. Am J Hypertens. 1999. PMID: 10411362 Review.
-
Enhanced antitumor efficacy in colon cancer using EGF functionalized PLGA nanoparticles loaded with 5-Fluorouracil and perfluorocarbon.BMC Cancer. 2020 Apr 28;20(1):354. doi: 10.1186/s12885-020-06803-7. BMC Cancer. 2020. PMID: 32345258 Free PMC article.
-
Oxcarbazepine free or loaded PLGA nanoparticles as effective intranasal approach to control epileptic seizures in rodents.Eur J Pharm Biopharm. 2018 Dec;133:309-320. doi: 10.1016/j.ejpb.2018.11.002. Epub 2018 Nov 3. Eur J Pharm Biopharm. 2018. PMID: 30399400
-
Fenoldopam: a review of its pharmacodynamic and pharmacokinetic properties and intravenous clinical potential in the management of hypertensive urgencies and emergencies.Drugs. 1997 Oct;54(4):634-50. doi: 10.2165/00003495-199754040-00008. Drugs. 1997. PMID: 9339965 Review.
Cited by
-
IL-6 Mutation Attenuates Liver Injury Caused by Aeromonas hydrophila Infection by Reducing Oxidative Stress in Zebrafish.Int J Mol Sci. 2023 Dec 7;24(24):17215. doi: 10.3390/ijms242417215. Int J Mol Sci. 2023. PMID: 38139043 Free PMC article.
-
Unveiling the potential of biomechanics in pioneering innovative strategies for cancer therapy.Theranostics. 2025 Feb 10;15(7):2903-2932. doi: 10.7150/thno.108605. eCollection 2025. Theranostics. 2025. PMID: 40083943 Free PMC article. Review.
-
Subtype-Selective Positive Modulation of KCa2.3 Channels Increases Cilia Length.ACS Chem Biol. 2022 Aug 19;17(8):2344-2354. doi: 10.1021/acschembio.2c00469. Epub 2022 Aug 10. ACS Chem Biol. 2022. PMID: 35947779 Free PMC article.
-
Measuring Calcium Signaling at the Primary Cilia.Methods Mol Biol. 2025;2861:129-140. doi: 10.1007/978-1-0716-4164-4_10. Methods Mol Biol. 2025. PMID: 39395102
-
Emerging Molecular Prospective of SARS-CoV-2: Feasible Nanotechnology Based Detection and Inhibition.Front Microbiol. 2020 Oct 20;11:2098. doi: 10.3389/fmicb.2020.02098. eCollection 2020. Front Microbiol. 2020. PMID: 33193115 Free PMC article. Review.
References
-
- Cui W; Li J; Decher G Self-Assembled Smart Nanocarriers for Targeted Drug Delivery. Adv. Mater 2016, 28 (6), 1302–11. - PubMed
-
- Polo E; Collado M; Pelaz B; Del Pino P Advances toward More Efficient Targeted Delivery of Nanoparticles in Vivo: Under-standing Interactions between Nanoparticles and Cells. ACS Nano 2017, 11 (3), 2397–2402. - PubMed
-
- Danhier F; Ansorena E; Silva JM; Coco R; Le Breton A; Preat V PLGA-based nanoparticles: an overview of biomedical applications. J. Controlled Release 2012, 161 (2), 505–22. - PubMed
Publication types
MeSH terms
Substances
Grants and funding
LinkOut - more resources
Full Text Sources
Medical
Molecular Biology Databases
