. 2018 Dec 22;20(1):48.
doi: 10.3390/ijms20010048.

A Novel Transcription Factor CaSBP12 Gene Negatively Regulates the Defense Response against Phytophthora capsici in Pepper (Capsicum annuum L.)

Affiliations

A Novel Transcription Factor CaSBP12 Gene Negatively Regulates the Defense Response against Phytophthora capsici in Pepper (Capsicum annuum L.)

Huai-Xia Zhang et al. Int J Mol Sci. .

Abstract

SBP-box (Squamosa-promoter binding protein) genes are a type of plant-specific transcription factor and play important roles in plant growth, signal transduction and stress response. However, little is known about the SBP-box genes in pepper (CaSBP), especially in the process of Phytophthora capsici infection. In this study, a novel gene (CaSBP12) was selected from the CaSBP gene family, which was isolated from the pepper genome database in our previous study. The CaSBP12 gene was located in the nucleus of the cell and its silencing in the pepper plant enhanced the defense response against Phytophthora capsici infection. After inoculation with Phytophthora capsici, the root activity of the CaSBP12-silenced plants is compared to control plants, while malondialdehyde (MDA) content is compared viceversa. Additionally, the expression of defense related genes (CaPO1, CaSAR8.2, CaBPR1, and CaDEF1) in the silenced plants were induced to different degrees and the peak of CaSAR8.2 and CaBPR1 were higher than that of CaDEF1. The CaSBP12 over-expressed Nicotiana benthamiana plants were more susceptible to Phytophthora capsici infection with higher EC (electrical conductivity) and MDA contents as compared to the wild-type. The relative expression of defense related genes (NbDEF, NbNPR1, NbPR1a, and NbPR1b) in transgenic and wild-type Nicotiana benthamiana plants were induced, especially the NbPR1a and NbPR1b. In conclusion, these results indicate that CaSBP12 gene negative regulates the defense response against Phytophthora capsici infection which suggests their potentially significant role in plant defense. To our knowledge, this is the first report on CaSBP gene which negative regulate defense response.

Keywords: CaSBP12; Nicotiana benthamiana; Phytophthora capsici; defense-related genes; pepper.


Conflict of interest statement

The authors declare no conflict of interest.

Figures

Figure 1
Figure 1
Subcellular localization of the CaSBP12 protein. Transient expression of 35S::GFP, 35S::CaSBP12::GFP in onion epidermal cells via particle bombardment. The fluorescence was visualized using a laser scanning confocal microscope under bright and fluorescence fields. The photographs were taken in a dark field for green fluorescence and under bright light for the morphology of the cell. Bars in this picture are 40μm.
Figure 2
Figure 2
Phenotypes and silencing efficiency of CaSBP12 in silenced and control plants. (A) Phenotypes of CaPDS-silenced, CaSBP12-silenced, and control plants. (B) Silencing efficiency of CaSBP12 and comparative expression of CaSBP04 (a highly homologous gene of CaSBP12) in the silenced and control plants. The red line used as a scale bar (length 3 cm). The means were analyzed using the least significant difference (LSD). * represents significant difference at p ≤ 0.05, and ** represents highly significant difference at p ≤ 0.01. Mean values and standard errors (SEs) for three replicates are shown.
Figure 3
Figure 3
Phenotypes of detached leaves of the CaSBP12-silenced and control plants after inoculation with P. capsici HX-9 (A) or PC (B) strains. (d: represents day). The red line used as a scale bar (length 0.8 cm).
Figure 4
Figure 4
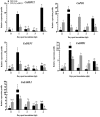
The expression of CaSBP12 and defense related genes after inoculation with the HX-9 strain of P. capsici in silenced and control plants. After measuring the silencing efficiency of the CaSBP12 gene, 5 mL of 1 × 10⁵ cfu/mL zoospore of P. capsici were used to inoculate the silenced and control plants, respectively, using the root-drench method, and then roots of silenced and control plants were collected at 0, 1, 2, 3, and 4 d for the detection of defense related genes. CaPO1 (Accession number: AF442386); CaDEF1 (Accession number: AF442388); CaBPR1 (Accession number: AF053343); CaSAR8.2 (Accession number: AF112868). The means were analyzed using the least significant difference (LSD). Bars with different lower-case letters indicate significant differences at p ≤ 0.05. Mean values and SEs for three replicates are shown.
Figure 5
Figure 5
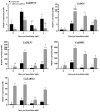
The expression of CaSBP12 and defense related genes after inoculation with the PC strain of P. capsici in silenced and control plants. After measuring the silencing efficiency of the CaSBP12 gene, 5 mL of 1 × 10⁵ cfu/mL zoospore of P. capsici were used to inoculate the silenced and control plants, respectively, using the root-drench method, and then roots of silenced and control plants were collected at 0, 2, 3, and 4 d for the detection of defense related genes. The means were analyzed using the least significant difference (LSD). Bars with different lower-case letters indicate significant difference at p ≤ 0.05. Mean values and SEs for three replicates are shown.
Figure 6
Figure 6
Determination of root activity of the silenced and control plants after inoculation with P. capsici strains (A) Phenotypes of the silenced and control plant roots stained with triphenyl-tetrazolium chloride (TTC) after inoculation with P. capsici at 0 d. (B) Phenotypes of the silenced and control plant roots stained with TTC after inoculation with the HX-9 strain of P. capsici at 2 d. (C) Phenotypes of the silenced and control plant roots stained with TTC after inoculation with the PC strain of P. capsici at 2 d. (D) Roots activity of the silenced and control plants after inoculation with P. capsici strains at 2 d. The means were analyzed using the least significant difference (LSD). Bars with different lower-case letters indicate significant differences at p ≤ 0.05. Mean values and SEs for three replicates are shown.
Figure 7
Figure 7
The malondialdehyde (MDA) content of the silenced and control plants after inoculation with P. capsici strains. (A) MDA content after inoculation with the HX-9 strain of P. capsici in silenced and control plants. (B) MDA content after inoculation with the PC strain of P. capsici in silenced and control plants. Bars with different lower-case letters indicate significant differences using the least significant difference (LSD) value (p ≤ 0.05). Mean values and SEs for three replicates are shown.
Figure 8
Figure 8
Phenotypes and disease index percent of the silenced and control plants after inoculation with the HX-9 strain of P. capsici. (A) Phenotypes of the silenced and control plants after inoculation with the HX-9 strain of P. capsici. The two yellow arrows indicated the constricted area of the stem. (B) Disease index percent of the silenced and control plants after being inoculated with the HX-9 strain of P. capsici. Photographs and disease index percent were counted and taken at 16-day post-inoculation, respectively. The red line is used as a scale bar (length 3 cm). Bars with different lower-case letters indicate significant differences using the least significant difference (LSD) value (p ≤ 0.05). Mean values and SEs are shown.
Figure 9
Figure 9
Phenotypes of the wild-type (WT), empty vector (P31, P33) and transgenic lines (line 4, line 7, and line 8) after inoculation with P. capsici and the expression of CaSBP12 in the transgenic, empty vector, and wild-type lines of N. benthamiana. (A) Phenotypes of the detached leaves of transgenic, empty vector, and wild-type lines after inoculation with P. capsici. (B) The expression of CaSBP12 in the transgenic, empty vector, and wild-type lines of N. benthamiana. The expression levels were analyzed between the transgenic lines (line 4, line 7, and line 8) and the wild-type (WT). (C) Phenotypes of the transgenic, empty vector, and wild-type (WT) lines after inoculation with P. capsici. The yellow arrows indicate the constricted area of the stem. Forty-five-day-old N. benthamiana plants were used for this experiment. The red line used as a scale bar (length 0.4 cm). The diameter of the plug of P. capsici used in this experiment is 0.4 cm. The diameter of the pot in Figure 9C is 7 cm. The means were analyzed using the least significant difference (LSD). Double asterisks (**) represents highly significant difference at p ≤ 0.01. Mean values and SEs for three replicates are shown.
Figure 10
Figure 10
Determination of biochemical indexes of transgenic (line 4, line 7, and line 8), empty vector (P31, P33), and wild-type lines after inoculation with P. capsici. (A) Conductivity of the transgenic, empty vector, and wild-type lines. (B) MDA content of the transgenic, empty vector, and wild-type lines. (C) Catalase (CAT) activity of the transgenic, empty vector, and wild-type lines. (D) peroxidase (POD) activity of the transgenic, empty vector, and wild-type lines. Data was analyzed between the transgenic lines (line 4, line 7, and line 8) and the wild-type and empty vector transgenic lines (P31 and P33) at the same time point using the least significant difference (LSD). ** or * in the figure indicates that transgenic lines (line 4, line 7, and line 8) had a significant difference (at p ≤ 0.01 or p ≤ 0.05) compared with control lines (wild-type and empty vector transgenic lines P31 and P33) at the same time point. Mean values and SEs for three replicates are shown.
Figure 11
Figure 11
The expression of defense-related genes after inoculation with P. capsici in transgenic (line 4, line 7, and line 8), empty vector (P31 and P33), and wild-type lines. The expression levels were analyzed between the transgenic lines (line 4, line 7, and line 8) and the wild-type and empty vector transgenic lines (P31 and P33) at the same time point using the least significant difference (LSD). * represents significant difference at p ≤ 0.05, and ** represents highly significant differences at p ≤ 0.01. Mean values and SEs for three replicates are shown.
Figure 12
Figure 12
Disease index percent of transgenic (line 4, line 7, and line 8), empty vector (P31, P33), and wild-type lines after inoculation with P. capsici and the disease index percent were calculated at 5, 8, 13, and 18 d. The data of disease index percent was analyzed between the transgenic lines (line 4, line 7, and line 8) and the wild-type and empty vector transgenic lines (P31 and P33) at the same time point using the least significant difference (LSD). ** represents highly significant difference at p ≤ 0.01. Mean values and SEs are shown.

Similar articles

Cited by

References

    1. Jin J.H., Zhang H.X., Tan J.Y., Yan M.J., Li D.W., Khan A., Gong Z.H. A new ethylene-responsive factor CaPTI1 gene of pepper (Capsicum annuum L.) involved in the regulation of defense response to Phytophthora capsici. Front Plant Sci. 2016;6:1217. doi: 10.3389/fpls.2015.01217. - DOI - PMC - PubMed
    1. Granke L.L., Quesada-Ocampo L., Lamour K., Hausbeck M.K. Advances in research on Phytophthora capsici on vegetable crops in the united states. Plant Dis. 2012;96:1588–1600. doi: 10.1094/PDIS-02-12-0211-FE. - DOI - PubMed
    1. Biles C.L., Brunton B.D., Wall M.M., Rivas M. Phytophthora capsici zoospore infection of pepper fruit in various physical environments. Proc. Okla. Acad. Sci. 1995;75:1–5.
    1. Mou S.L., Liu Z.Q., Gao F., Yang S., Su M.X., Shen L., Wu Y., He S.L. CaHDZ27, a Homeodomain-Leucine Zipper I (HD-Zip I) protein, positively regulates the resistance to Ralstonia solanacearum Infection in pepper. Mol. Plant-Microbe Interact. 2017;30:960–973. doi: 10.1094/MPMI-06-17-0130-R. - DOI - PubMed
    1. Wang Y., Wang H., Ma Y., Du H., Yang Q., Yu D. Identification of transcriptional regulatory nodes in soybean defense networks using transient co-transactivation assays. Front. Plant Sci. 2015;6:915. doi: 10.3389/fpls.2015.00915. - DOI - PMC - PubMed

MeSH terms

LinkOut - more resources