. 2018 Dec 23;8(1):19.
doi: 10.3390/jcm8010019.

Optimizing Detection of Kidney Transplant Injury by Assessment of Donor-Derived Cell-Free DNA via Massively Multiplex PCR

Affiliations

Optimizing Detection of Kidney Transplant Injury by Assessment of Donor-Derived Cell-Free DNA via Massively Multiplex PCR

Tara K Sigdel et al. J Clin Med. .

Abstract

Standard noninvasive methods for detecting renal allograft rejection and injury have poor sensitivity and specificity. Plasma donor-derived cell-free DNA (dd-cfDNA) has been reported to accurately detect allograft rejection and injury in transplant recipients and shown to discriminate rejection from stable organ function in kidney transplant recipients. This study used a novel single nucleotide polymorphism (SNP)-based massively multiplexed PCR (mmPCR) methodology to measure dd-cfDNA in various types of renal transplant recipients for the detection of allograft rejection/injury without prior knowledge of donor genotypes. A total of 300 plasma samples (217 biopsy-matched: 38 with active rejection (AR), 72 borderline rejection (BL), 82 with stable allografts (STA), and 25 with other injury (OI)) were collected from 193 unique renal transplant patients; dd- cfDNA was processed by mmPCR targeting 13,392 SNPs. Median dd-cfDNA was significantly higher in samples with biopsy-proven AR (2.3%) versus BL (0.6%), OI (0.7%), and STA (0.4%) (p < 0.0001 all comparisons). The SNP-based dd-cfDNA assay discriminated active from non-rejection status with an area under the curve (AUC) of 0.87, 88.7% sensitivity (95% CI, 77.7⁻99.8%) and 72.6% specificity (95% CI, 65.4⁻79.8%) at a prespecified cutoff (>1% dd-cfDNA). Of 13 patients with AR findings at a routine protocol biopsy six-months post transplantation, 12 (92%) were detected positive by dd-cfDNA. This SNP-based dd-cfDNA assay detected allograft rejection with superior performance compared with the current standard of care. These data support the feasibility of using this assay to detect disease prior to renal failure and optimize patient management in the case of allograft injury.

Keywords: cfDNA; kidney transplantation; rejection.


Conflict of interest statement

T.K.S., J.L., I.D., P.T., R.D.S., C.C.-O., S.-C.H, and M.M.S. declare no conflicts. F.A.A., T.C., S.A.P., S.N., E.K., Z.P.D., A.R., S.S., B.Z., P.R.B., and S.M. are or were employees of Natera, Inc. with stock/options to own stock in the company.

Figures

Figure 1
Figure 1
Plasma sample breakdown. AR, active rejection. a Collected within three days post transplantation; b samples drawn on the day of biopsy (i.e., were biopsy-matched).
Figure 2
Figure 2
Discrimination of active rejection by dd-cfDNA versus eGFR. (A) and (B): Boxes indicate interquartile range (25th to 75th percentile); horizontal lines in boxes represent medians; each dot depicts one sample. p-values for dd-cfDNA and eGFR adjusted using Kruskal–Wallis rank sum test followed by Dunn multiple comparison tests with Holm correction. *** indicates adj. p < 0.0001 from all other group comparisons (see Table S2). AR, active rejection; BL, borderline; OI, other injury; STA, stable; dd-cfDNA, donor-derived cell-free DNA; eGFR, estimate glomerular filtration rate.
Figure 3
Figure 3
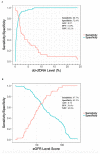
Predictive statistics for active rejection versus non-rejection. Sensitivity (red line) and specificity (blue line) are depicted over the observed range of dd-cfDNA levels (A) and eGFR scores (B). Reported sensitivity and specificity correspond to cutoffs of 1% for dd-cfDNA and a score of 60 for eGFR. PPV and NPV are based on a 25% AR prevalence. AUC, area under the curve; PPV, positive predictive value; NPV, negative predictive value.
Figure 4
Figure 4
Discrimination of active rejection by dd-cfDNA in biopsy-matched samples stratified by biopsy type. The number of samples per group and the distribution of their dd-cfDNA levels are depicted for protocol biopsy (A) and for-cause biopsy (B) samples. Boxes indicate inter-quartile range, horizontal lines represent medians. AR, active rejection; BL, borderline; OI, other injury; STA, stable.
Figure 5
Figure 5
dd-cfDNA as a function of antibody-mediated—versus T-cell—mediated rejection. Boxes indicate interquartile range (25th to 75th percentile); horizontal lines in boxes represent medians; dots indicate all individual data points. p-values for dd-cfDNA adjusted using Kruskal–Wallis rank sum test. a Samples assigned ABMR or ABMR and bTCMR. b Samples assigned ABMR and TCMR. c Samples assigned TCMR or TCMR and bABMR. ABMR, antibody-mediated rejection; TCMR, T-cell-mediated rejection.
Figure 6
Figure 6
Relationship between dd-cfDNA and donor type. Boxes indicate inter-quartile range, horizontal lines represent medians. p-values for dd-cfDNA an ANOVA Wald-test with Kenward–Roger approximation for the degrees of freedom was followed by Tukey’s post-hoc test. AR, active rejection.
Figure 7
Figure 7
Variability in dd-cfDNA in non-rejection patients over time. (A) Inter-patient variability (60 samples from 60 patients over time); (B) intra-patient variability (samples from the same 10 patients over time); (C) change in dd-cfDNA levels over time in patients with active rejection. AR, active rejection; BL, borderline; OI, other injury; STA, stable.
Figure 7
Figure 7
Variability in dd-cfDNA in non-rejection patients over time. (A) Inter-patient variability (60 samples from 60 patients over time); (B) intra-patient variability (samples from the same 10 patients over time); (C) change in dd-cfDNA levels over time in patients with active rejection. AR, active rejection; BL, borderline; OI, other injury; STA, stable.

References

    1. Jacquemont L., Soulillou J.P., Degauque N. Blood biomarkers of kidney transplant rejection, an endless search? Expert Rev. Mol. Diagn. 2017;17:687–697. doi: 10.1080/14737159.2017.1337512. - DOI - PubMed
    1. Humar A., Kerr S., Hassoun A., Granger D., Suhr B., Matas A. The association between acute rejection and chronic rejection in kidney transplantation. Transplant. Proc. 1999;31:1302–1303. doi: 10.1016/S0041-1345(98)02006-5. - DOI - PubMed
    1. Nankivell B.J., Alexander S.I. Rejection of the kidney allograft. N. Engl. J. Med. 2010;363:1451–1462. doi: 10.1056/NEJMra0902927. - DOI - PubMed
    1. Sigdel T.K., Sarwal M.M. The proteogenomic path towards biomarker discovery. Pediatr. Transplant. 2008;12:737–747. doi: 10.1111/j.1399-3046.2008.01018.x. - DOI - PMC - PubMed
    1. Lo D.J., Kaplan B., Kirk A.D. Biomarkers for kidney transplant rejection. Nat. Rev. Nephrol. 2014;10:215–225. doi: 10.1038/nrneph.2013.281. - DOI - PubMed