

DNA methylation in nasal epithelium, atopy, and atopic asthma in children: a genome-wide study
- PMID: 30584054
- PMCID: PMC6441380
- DOI: 10.1016/S2213-2600(18)30466-1
DNA methylation in nasal epithelium, atopy, and atopic asthma in children: a genome-wide study
Abstract
Background: Epigenetic mechanisms could alter the airway epithelial barrier and ultimately lead to atopic diseases such as asthma. We aimed to identify DNA methylation profiles that are associated with-and could accurately classify-atopy and atopic asthma in school-aged children.
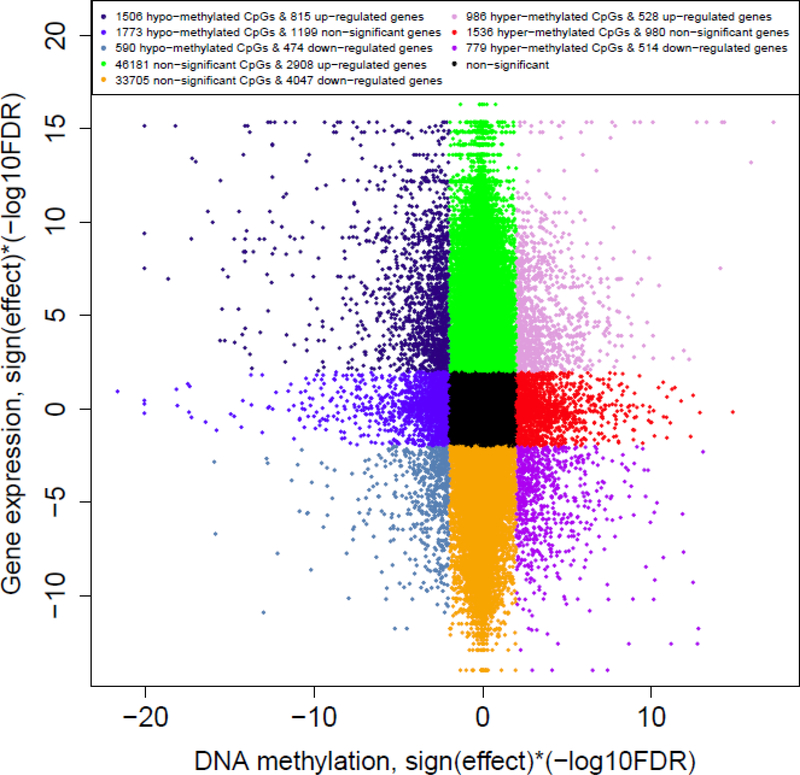
Methods: We did a genome-wide study of DNA methylation in nasal epithelium and atopy or atopic asthma in 483 Puerto Rican children aged 9-20 years, recruited using multistage probability sampling. Atopy was defined as at least one positive IgE (≥0·35 IU/mL) to common aeroallergens, and asthma was defined as a physician's diagnosis plus wheeze in the previous year. Significant (false discovery rate p<0·01) methylation signals were correlated with gene expression, and top CpGs were validated by pyrosequencing. We then replicated our top methylation findings in a cohort of 72 predominantly African American children, and in 432 children from a European birth cohort. Next, we tested classification models based on nasal methylation for atopy or atopic asthma in all cohorts.
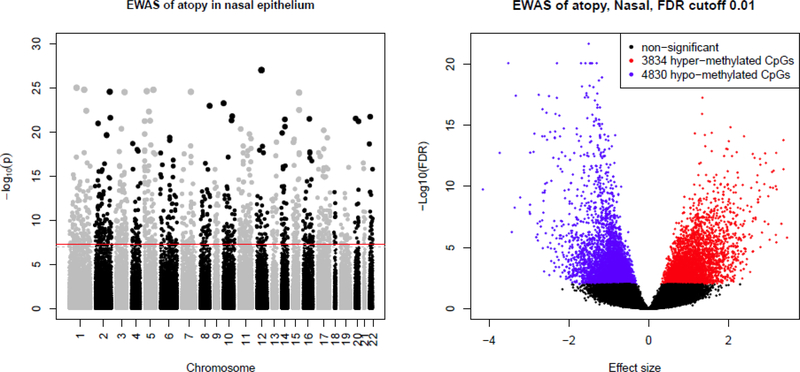
Findings: DNA methylation profiles were markedly different between children with (n=312) and without (n=171) atopy in the Puerto Rico discovery cohort, recruited from Feb 12, 2014, until May 8, 2017. After adjustment for covariates and multiple testing, we found 8664 differentially methylated CpGs by atopy, with false discovery rate-adjusted p values ranging from 9·58 × 10-17 to 2·18 × 10-22 for the top 30 CpGs. These CpGs were in or near genes relevant to epithelial barrier function, including CDHR3 and CDH26, and in other genes related to airway epithelial integrity and immune regulation, such as FBXL7, NTRK1, and SLC9A3. Moreover, 28 of the top 30 CpGs replicated in the same direction in both independent cohorts. Classification models of atopy based on nasal methylation performed well in the Puerto Rico cohort (area under the curve [AUC] 0·93-0·94 and accuracy 85-88%) and in both replication cohorts (AUC 0·74-0·92, accuracy 68-82%). The models also performed well for atopic asthma in the Puerto Rico cohort (AUC 0·95-1·00, accuracy 88%) and the replication cohorts (AUC 0·82-0·88, accuracy 86%).
Interpretation: We identified specific methylation profiles in airway epithelium that are associated with atopy and atopic asthma in children, and a nasal methylation panel that could classify children by atopy or atopic asthma. Our findings support the feasibility of using the nasal methylome for future clinical applications, such as predicting the development of asthma among wheezing infants.
Funding: US National Institutes of Health.
Copyright © 2019 Elsevier Ltd. All rights reserved.
Conflict of interest statement
Figures

Comment in
-
DNA methylation signatures of atopy and asthma.Lancet Respir Med. 2019 Apr;7(4):289-290. doi: 10.1016/S2213-2600(18)30504-6. Epub 2018 Dec 21. Lancet Respir Med. 2019. PMID: 30584055 No abstract available.
-
DNA methylation and a biomarker panel to predict asthma development.J Allergy Clin Immunol. 2019 Jul;144(1):49-50. doi: 10.1016/j.jaci.2019.04.002. Epub 2019 Apr 11. J Allergy Clin Immunol. 2019. PMID: 30981596 No abstract available.
Similar articles
-
Expression Quantitative Trait Methylation Analysis Reveals Methylomic Associations With Gene Expression in Childhood Asthma.Chest. 2020 Nov;158(5):1841-1856. doi: 10.1016/j.chest.2020.05.601. Epub 2020 Jun 20. Chest. 2020. PMID: 32569636 Free PMC article.
-
Cis- and trans-eQTM analysis reveals novel epigenetic and transcriptomic immune markers of atopic asthma in airway epithelium.J Allergy Clin Immunol. 2023 Oct;152(4):887-898. doi: 10.1016/j.jaci.2023.05.018. Epub 2023 Jun 2. J Allergy Clin Immunol. 2023. PMID: 37271320 Free PMC article.
-
Nasal DNA methylation profiling of asthma and rhinitis.J Allergy Clin Immunol. 2020 Jun;145(6):1655-1663. doi: 10.1016/j.jaci.2019.12.911. Epub 2020 Jan 14. J Allergy Clin Immunol. 2020. PMID: 31953105 Free PMC article.
-
Epigenome-wide association studies in asthma: A systematic review.Clin Exp Allergy. 2019 Jul;49(7):953-968. doi: 10.1111/cea.13403. Epub 2019 May 14. Clin Exp Allergy. 2019. PMID: 31009112
-
Epigenome-wide association studies of allergic disease and the environment.J Allergy Clin Immunol. 2023 Sep;152(3):582-590. doi: 10.1016/j.jaci.2023.05.020. Epub 2023 Jun 7. J Allergy Clin Immunol. 2023. PMID: 37295475 Free PMC article. Review.
Cited by
-
Epigenetic landscape links upper airway microbiota in infancy with allergic rhinitis at 6 years of age.J Allergy Clin Immunol. 2020 Dec;146(6):1358-1366. doi: 10.1016/j.jaci.2020.07.005. Epub 2020 Jul 18. J Allergy Clin Immunol. 2020. PMID: 32693091 Free PMC article. Clinical Trial.
-
Indoor endotoxin, proximity to a major roadway, and severe asthma exacerbations among children in Puerto Rico.Ann Allergy Asthma Immunol. 2020 Dec;125(6):658-664.e2. doi: 10.1016/j.anai.2020.09.001. Epub 2020 Sep 8. Ann Allergy Asthma Immunol. 2020. PMID: 32911057 Free PMC article.
-
SNPs identified by GWAS affect asthma risk through DNA methylation and expression of cis-genes in airway epithelium.Eur Respir J. 2020 Apr 3;55(4):1902079. doi: 10.1183/13993003.02079-2019. Print 2020 Apr. Eur Respir J. 2020. PMID: 31831581 Free PMC article.
-
Eliminating health disparities in asthma: Are we at the end of the beginning?Ann Allergy Asthma Immunol. 2019 Jul;123(1):3-5. doi: 10.1016/j.anai.2019.02.001. Epub 2019 Feb 10. Ann Allergy Asthma Immunol. 2019. PMID: 30742917 Free PMC article. No abstract available.
-
Nasal DNA methylation differentiates severe from non-severe asthma in African-American children.Allergy. 2021 Jun;76(6):1836-1845. doi: 10.1111/all.14655. Epub 2020 Nov 25. Allergy. 2021. PMID: 33175399 Free PMC article.
References
-
- Demenais F, Margaritte-Jeannin P, Barnes KC, Cookson WOC, Altmuller J, Ang W, et al. Multiancestry association study identifies new asthma risk loci that colocalize with immune-cell enhancer marks. Nat Genet. 2018. January;50(1):42–53. PubMed PMID: Pubmed Central PMCID: PMC5901974. Epub 2017/12/24. eng. - PMC - PubMed
-
- Koning H, Sayers I, Stewart CE, de Jong D, Ten Hacken NH, Postma DS, et al. Characterization of protocadherin-1 expression in primary bronchial epithelial cells: association with epithelial cell differentiation. FASEB J. 2012. January;26(1):439–48. PubMed PMID: Epub 2011/10/11. - PubMed
