

Multiomics of azacitidine-treated AML cells reveals variable and convergent targets that remodel the cell-surface proteome
- PMID: 30584089
- PMCID: PMC6329958
- DOI: 10.1073/pnas.1813666116
Multiomics of azacitidine-treated AML cells reveals variable and convergent targets that remodel the cell-surface proteome
Abstract
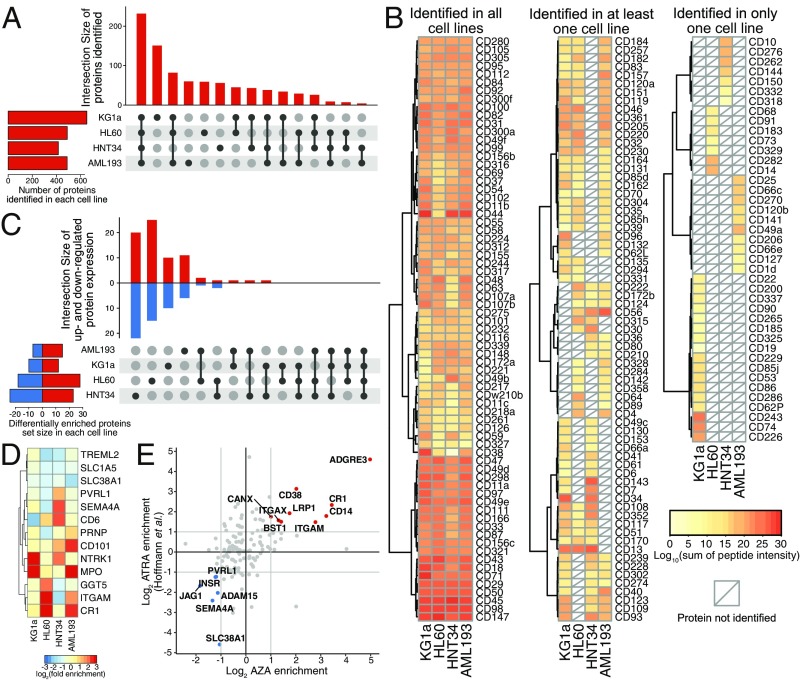
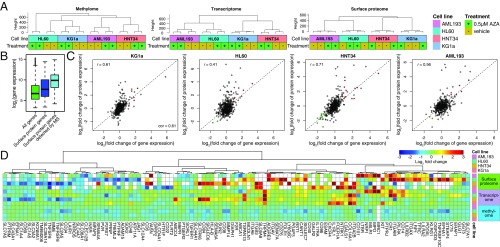
Myelodysplastic syndromes (MDS) and acute myeloid leukemia (AML) are diseases of abnormal hematopoietic differentiation with aberrant epigenetic alterations. Azacitidine (AZA) is a DNA methyltransferase inhibitor widely used to treat MDS and AML, yet the impact of AZA on the cell-surface proteome has not been defined. To identify potential therapeutic targets for use in combination with AZA in AML patients, we investigated the effects of AZA treatment on four AML cell lines representing different stages of differentiation. The effect of AZA treatment on these cell lines was characterized at three levels: the DNA methylome, the transcriptome, and the cell-surface proteome. Untreated AML cell lines showed substantial overlap at all three omics levels; however, while AZA treatment globally reduced DNA methylation in all cell lines, changes in the transcriptome and surface proteome were subtle and differed among the cell lines. Transcriptome analysis identified five commonly up-regulated coding genes upon AZA treatment in all four cell lines, TRPM4 being the only gene encoding a surface protein, and surface proteome analysis found no commonly regulated proteins. Gene set enrichment analysis of differentially regulated RNA and surface proteins showed a decrease in metabolic pathways and an increase in immune defense response pathways. As such, AZA treatment led to diverse effects at the individual gene and protein levels but converged to common responses at the pathway level. Given the heterogeneous responses in the four cell lines, we discuss potential therapeutic strategies for AML in combination with AZA.
Keywords: AML; azacitidine; multiomics; surface proteomics; target discovery.
Conflict of interest statement
Conflict of interest statement: This study was funded by the Celgene Corporation. A.N., T.S., L.T., X.N., L.E., K.J.M., and J.D. are employees of Celgene Corporation. K.K.L. and J.A.W. received research funding from Celgene Corporation but no personal financial gain or equity.
Figures


Similar articles
-
The DNA demethylating agent 5-aza-2'-deoxycytidine induces expression of NY-ESO-1 and other cancer/testis antigens in myeloid leukemia cells.Leuk Res. 2010 Jul;34(7):899-905. doi: 10.1016/j.leukres.2010.02.004. Epub 2010 Apr 10. Leuk Res. 2010. PMID: 20381863
-
5-Aza-2'-deoxycytidine induces p21WAF expression by demethylation of p73 leading to p53-independent apoptosis in myeloid leukemia.Int J Cancer. 2005 May 1;114(5):683-95. doi: 10.1002/ijc.20797. Int J Cancer. 2005. PMID: 15609309
-
Increasing TIMP3 expression by hypomethylating agents diminishes soluble MICA, MICB and ULBP2 shedding in acute myeloid leukemia, facilitating NK cell-mediated immune recognition.Oncotarget. 2017 May 9;8(19):31959-31976. doi: 10.18632/oncotarget.16657. Oncotarget. 2017. PMID: 28404876 Free PMC article.
-
Digging deep into "dirty" drugs - modulation of the methylation machinery.Drug Metab Rev. 2015 May;47(2):252-79. doi: 10.3109/03602532.2014.995379. Epub 2015 Jan 8. Drug Metab Rev. 2015. PMID: 25566693 Free PMC article. Review.
-
Predictors of clinical responses to hypomethylating agents in acute myeloid leukemia or myelodysplastic syndromes.Ann Hematol. 2018 Nov;97(11):2025-2038. doi: 10.1007/s00277-018-3464-9. Epub 2018 Aug 6. Ann Hematol. 2018. PMID: 30084010 Review.
Cited by
-
Non-cleavable hinge enhances avidity and expansion of CAR-T cells for acute myeloid leukemia.Cancer Cell. 2022 May 9;40(5):494-508.e5. doi: 10.1016/j.ccell.2022.04.001. Epub 2022 Apr 21. Cancer Cell. 2022. PMID: 35452603 Free PMC article.
-
CCRL2 affects the sensitivity of myelodysplastic syndrome and secondary acute myeloid leukemia cells to azacitidine.Haematologica. 2023 Jul 1;108(7):1886-1899. doi: 10.3324/haematol.2022.281444. Haematologica. 2023. PMID: 36519323 Free PMC article.
-
Comprehensive analysis of m6A methylome alterations after azacytidine plus venetoclax treatment for acute myeloid leukemia by nanopore sequencing.Comput Struct Biotechnol J. 2024 Mar 2;23:1144-1153. doi: 10.1016/j.csbj.2024.02.029. eCollection 2024 Dec. Comput Struct Biotechnol J. 2024. PMID: 38510975 Free PMC article.
-
Veneer Is a Webtool for Rapid, Standardized, and Transparent Interpretation, Annotation, and Reporting of Mammalian Cell Surface N-Glycocapture Data.J Proteome Res. 2024 Aug 2;23(8):3235-3248. doi: 10.1021/acs.jproteome.3c00800. Epub 2024 Feb 27. J Proteome Res. 2024. PMID: 38412263 Free PMC article.
-
Silylation of Deoxynucleotide Analog Yields an Orally Available Drug with Antileukemia Effects.Mol Cancer Ther. 2021 Aug;20(8):1412-1421. doi: 10.1158/1535-7163.MCT-20-1125. Epub 2021 May 27. Mol Cancer Ther. 2021. PMID: 34045225 Free PMC article.
References
-
- Döhner H, et al. Diagnosis and management of acute myeloid leukemia in adults: Recommendations from an international expert panel, on behalf of the European LeukemiaNet. Blood. 2010;115:453–474. - PubMed
-
- David Allis C, Jenuwein T. The molecular hallmarks of epigenetic control. Nat Rev Genet. 2016;17:487–500. - PubMed
-
- Esteller M. Cancer epigenomics: DNA methylomes and histone-modification maps. Nat Rev Genet. 2007;8:286–298. - PubMed
Publication types
MeSH terms
Substances
Grants and funding
LinkOut - more resources
Full Text Sources
Other Literature Sources
Medical
Molecular Biology Databases
Research Materials
Miscellaneous
