

Oral Dextromethorphan for the Treatment of Diabetic Macular Edema: Results From a Phase I/II Clinical Study
- PMID: 30584490
- PMCID: PMC6300336
- DOI: 10.1167/tvst.7.6.24
Oral Dextromethorphan for the Treatment of Diabetic Macular Edema: Results From a Phase I/II Clinical Study
Abstract
Purpose: The activation of microglia, the primary innate immune cell resident in the retina, produces inflammatory mediators, which underlie changes in diabetic retinopathy including increased vascular permeability. This study evaluates the safety and efficacy of dextromethorphan, a drug capable of inhibiting microglial activation, in the treatment of diabetic macular edema (DME).
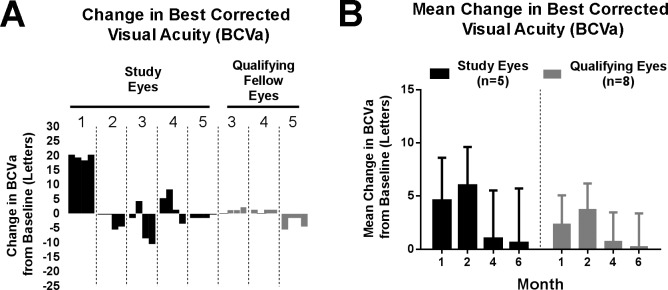
Methods: A single-center, prospective, open-label phase I/II clinical trial enrolled five participants with macular involving DME who received oral dextromethorphan 60 mg twice daily for 6 months as monotherapy. Main outcome variables included central retinal subfield thickness (CST), best-corrected visual acuity (BCVA), macula sensitivity, and late leakage on fluorescein angiogram (FA).
Results: The study drug was well tolerated. At the primary end point of 6 months, mean CST decreased by -6.3% ± 6.8% and BCVA increased by +0.6 ± 5.11 (mean ± SEM) letters. Late leakage on FA was scored as improved in four of five study eyes. These findings were not correlated with changes in hemoglobin A1c (HbA1c), creatinine, or blood pressure.
Conclusions: In this proof-of-concept study, dextromethorphan administration as the primary treatment for DME was associated with decreased vascular leakage, suggesting possible therapeutic effects. Additional studies investigating the modulation of microglial activation is warranted.
Translational relevance: These findings highlight microglial modulation as a potentially useful therapeutic strategy in the treatment of diabetic macular edema.
Keywords: diabetes; diabetic retinopathy; microglia; retina.
Figures


Similar articles
-
Oral minocycline for the treatment of diabetic macular edema (DME): results of a phase I/II clinical study.Invest Ophthalmol Vis Sci. 2012 Jun 22;53(7):3865-74. doi: 10.1167/iovs.11-9413. Invest Ophthalmol Vis Sci. 2012. PMID: 22589436 Free PMC article. Clinical Trial.
-
Visual Acuity in Retinal Vein Occlusion, Diabetic, and Uveitic Macular Edema: Central Subfield Thickness and Ellipsoid Zone Analysis.Ophthalmol Retina. 2021 Jul;5(7):633-647. doi: 10.1016/j.oret.2020.10.016. Epub 2020 Oct 29. Ophthalmol Retina. 2021. PMID: 33130256 Clinical Trial.
-
Oral minocycline for the treatment of retinitis pigmentosa-associated cystoid macular edema: results of a phase I/II clinical trial.Graefes Arch Clin Exp Ophthalmol. 2023 Aug;261(8):2209-2220. doi: 10.1007/s00417-023-05986-6. Epub 2023 Mar 8. Graefes Arch Clin Exp Ophthalmol. 2023. PMID: 36882562 Clinical Trial.
-
Treatment of diabetic macular edema with an inhibitor of vascular endothelial-protein tyrosine phosphatase that activates Tie2.Ophthalmology. 2015 Mar;122(3):545-54. doi: 10.1016/j.ophtha.2014.09.023. Epub 2014 Nov 12. Ophthalmology. 2015. PMID: 25439435 Clinical Trial.
-
Efficacy of Ranibizumab in Eyes with Diabetic Macular Edema and Macular Nonperfusion in RIDE and RISE.Ophthalmology. 2018 Oct;125(10):1568-1574. doi: 10.1016/j.ophtha.2018.04.002. Epub 2018 May 8. Ophthalmology. 2018. PMID: 29752001 Clinical Trial.
Cited by
-
Influence of OCT biomarkers on microperimetry intra- and interdevice repeatability in diabetic macular edema.Sci Rep. 2024 Oct 7;14(1):23342. doi: 10.1038/s41598-024-74230-w. Sci Rep. 2024. PMID: 39375434 Free PMC article.
-
Diabetic Macular Edema: Current Understanding, Molecular Mechanisms and Therapeutic Implications.Cells. 2022 Oct 25;11(21):3362. doi: 10.3390/cells11213362. Cells. 2022. PMID: 36359761 Free PMC article. Review.
-
Clinical Perspectives and Trends: Microperimetry as a Trial Endpoint in Retinal Disease.Ophthalmologica. 2021;244(5):418-450. doi: 10.1159/000515148. Epub 2021 Feb 10. Ophthalmologica. 2021. PMID: 33567434 Free PMC article. Review.
References
-
- Centers for Disease Control and Prevention. National Diabetes Statistics Report: Estimates of Diabetes and Its Burden in the United States, 2014. Atlanta, GA: US Department of Health and Human Services; 2014.
-
- Klein R, Klein BE, Moss SE, Davis MD, DeMets DL. The Wisconsin epidemiologic study of diabetic retinopathy. IV. Diabetic macular edema. Ophthalmology. 1984;91:1464–1474. - PubMed
-
- Ferris FL, III, Patz A. Macular edema: a major complication of diabetic retinopathy. Trans New Orleans Acad Ophthalmol. 1983;31:307–316. - PubMed
-
- Early Treatment Diabetic Retinopathy Study Research Group. Photocoagulation for diabetic macular edema. Early Treatment Diabetic Retinopathy Study report number 1. Arch Ophthalmol. 1985;103:1796–1806. - PubMed
LinkOut - more resources
Full Text Sources
Medical
