

Ex Vivo Assessment of Porcine Donation After Circulatory Death Lungs That Undergo Increasing Warm Ischemia Times
- PMID: 30584586
- PMCID: PMC6283086
- DOI: 10.1097/TXD.0000000000000845
Ex Vivo Assessment of Porcine Donation After Circulatory Death Lungs That Undergo Increasing Warm Ischemia Times
Abstract
Background: Increased utilization of donation after circulatory death (DCD) lungs may help alleviate the supply/demand mismatch between available donor organs and lung transplant candidates. Using an established porcine DCD model, we sought to determine the effect of increasing warm ischemia time (WIT) after circulatory arrest on lung function during ex vivo lung perfusion (EVLP).
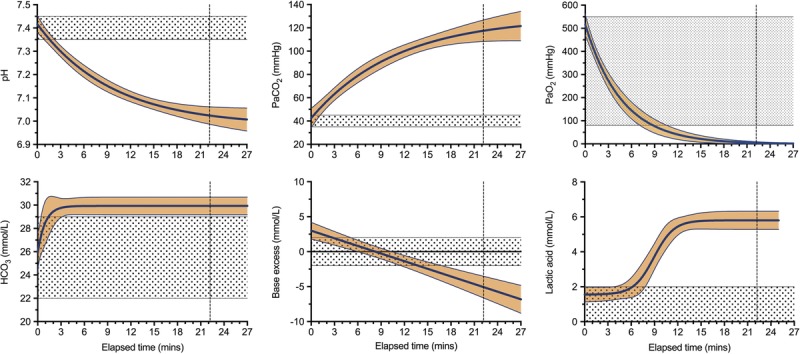
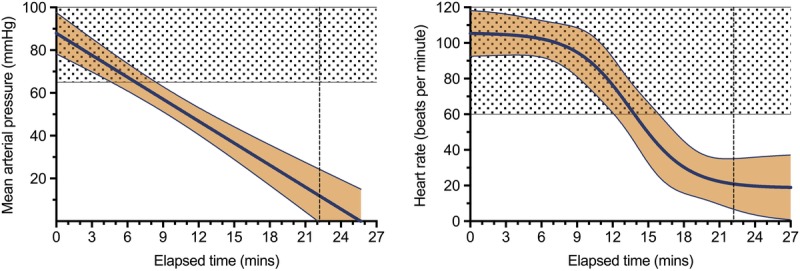
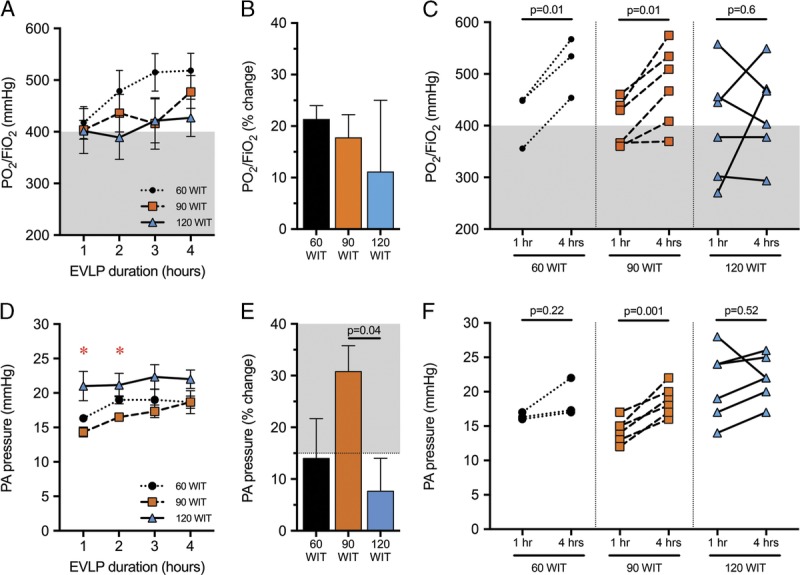
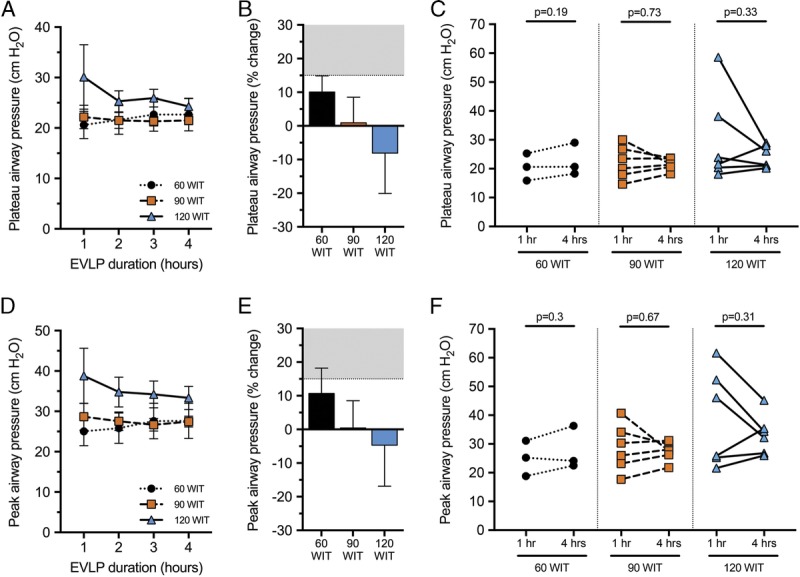
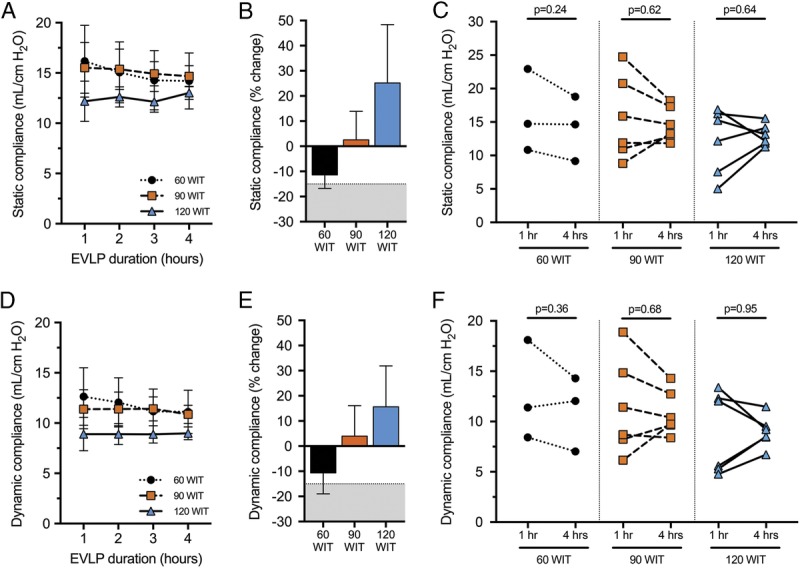
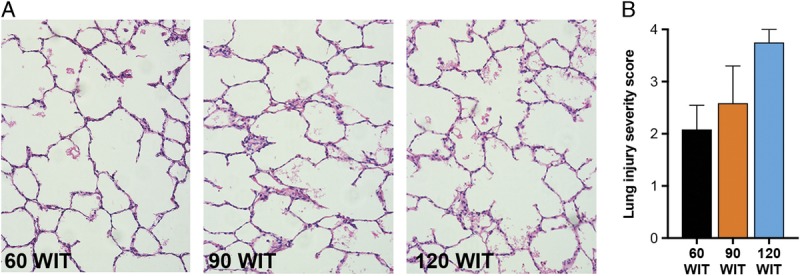
Methods: Porcine donors (n = 15) underwent hypoxic cardiac arrest, followed by 60, 90, or 120 minutes of WIT before procurement and 4 hours of normothermic EVLP. Oxygenation, pulmonary artery pressure, airway pressure, and compliance were measured hourly. Lung injury scores were assessed histologically after 4 hours of EVLP.
Results: After EVLP, all 3 groups met all the criteria for transplantation, except for 90-minute WIT lungs, which had a mean pulmonary artery pressure increase greater than 15%. There were no significant differences between groups as assessed by final oxygenation capacity, as well as changes in pulmonary artery pressure, airway pressure, or lung compliance. Histologic lung injury scores as well as lung wet-to-dry weight ratios did not significantly differ between groups.
Conclusions: These results suggest that longer WIT alone (up to 120 minutes) does not predict worse lung function at the conclusion of EVLP. Expanding acceptable WIT after circulatory death may eventually allow for increased utilization of DCD lungs in procurement protocols.
Conflict of interest statement
The authors declare no conflicts of interest.
Figures
Similar articles
-
Lungs donated after circulatory death and prolonged warm ischemia are transplanted successfully after enhanced ex vivo lung perfusion using adenosine A2B receptor antagonism.J Thorac Cardiovasc Surg. 2017 Nov;154(5):1811-1820. doi: 10.1016/j.jtcvs.2017.02.072. Epub 2017 Apr 12. J Thorac Cardiovasc Surg. 2017. PMID: 28483262 Free PMC article.
-
Prioritizing direct heart procurement in organ donors after circulatory death does not jeopardize lung transplant outcomes.JTCVS Tech. 2022 Oct 6;16:182-195. doi: 10.1016/j.xjtc.2022.08.032. eCollection 2022 Dec. JTCVS Tech. 2022. PMID: 36510519 Free PMC article.
-
An experimental study of the recovery of injured porcine lungs with prolonged normothermic cellular ex vivo lung perfusion following donation after circulatory death.Transpl Int. 2017 Sep;30(9):932-944. doi: 10.1111/tri.12981. Epub 2017 Jul 19. Transpl Int. 2017. PMID: 28493634
-
Donation after circulatory death donors in lung transplantation.J Thorac Dis. 2021 Nov;13(11):6536-6549. doi: 10.21037/jtd-2021-13. J Thorac Dis. 2021. PMID: 34992833 Free PMC article. Review.
-
Progress of Clinical Application for Ex Vivo Lung Perfusion (EVLP) in Lung Transplantation.Methods Mol Biol. 2020;2204:217-224. doi: 10.1007/978-1-0716-0904-0_19. Methods Mol Biol. 2020. PMID: 32710328 Review.
Cited by
-
Optimizing organs for transplantation; advancements in perfusion and preservation methods.Transplant Rev (Orlando). 2020 Jan;34(1):100514. doi: 10.1016/j.trre.2019.100514. Epub 2019 Oct 17. Transplant Rev (Orlando). 2020. PMID: 31645271 Free PMC article. Review. No abstract available.
-
Glucagon-like peptide-1 stimulates acute secretion of pro-atrial natriuretic peptide from the isolated, perfused pig lung exposed to warm ischemia.Front Transplant. 2022 Dec 6;1:1082634. doi: 10.3389/frtra.2022.1082634. eCollection 2022. Front Transplant. 2022. PMID: 38994393 Free PMC article.
-
Inflammation and Oxidative Stress in the Context of Extracorporeal Cardiac and Pulmonary Support.Front Immunol. 2022 Mar 4;13:831930. doi: 10.3389/fimmu.2022.831930. eCollection 2022. Front Immunol. 2022. PMID: 35309362 Free PMC article. Review.
-
Donation after circulatory death and lung transplantation.J Bras Pneumol. 2022 Apr 20;48(2):e20210369. doi: 10.36416/1806-3756/e20210369. eCollection 2022. J Bras Pneumol. 2022. PMID: 35475865 Free PMC article. Review.
-
Cellular recovery after prolonged warm ischaemia of the whole body.Nature. 2022 Aug;608(7922):405-412. doi: 10.1038/s41586-022-05016-1. Epub 2022 Aug 3. Nature. 2022. PMID: 35922506 Free PMC article.
References
-
- U.S. Department of Health & Human Services. Organ Procurement and Transplantation Network: National Data. https://optntransplanthrsagov/data/view-data-reports/national-data/.
-
- Steinbrook R. Organ donation after cardiac death. N Engl J Med. 2007;357:209–213. - PubMed
-
- Valapour M, Skeans MA, Smith JM, et al. OPTN/SRTR 2015 Annual Data Report: Lung. Am J Transplant. 2017;17(Suppl 1):357–424. - PubMed
-
- Cypel M, Levvey B, Van Raemdonck D, et al. International Society for Heart and Lung Transplantation donation after circulatory death registry report. J Heart Lung Transplant. 2015;34:1278–1282. - PubMed
-
- Krutsinger D, Reed RM, Blevins A, et al. Lung transplantation from donation after cardiocirculatory death: a systematic review and meta-analysis. J Heart Lung Transplant. 2015;34:675–684. - PubMed
Grants and funding
LinkOut - more resources
Full Text Sources
Miscellaneous
