

Safety Evaluation of the MiniMed 670G System in Children 7-13 Years of Age with Type 1 Diabetes
- PMID: 30585770
- PMCID: PMC6350071
- DOI: 10.1089/dia.2018.0264
Safety Evaluation of the MiniMed 670G System in Children 7-13 Years of Age with Type 1 Diabetes
Abstract
Objective: To evaluate the safety of in-home use of the MiniMed™ 670G system with SmartGuard™ technology in children with type 1 diabetes (T1D).
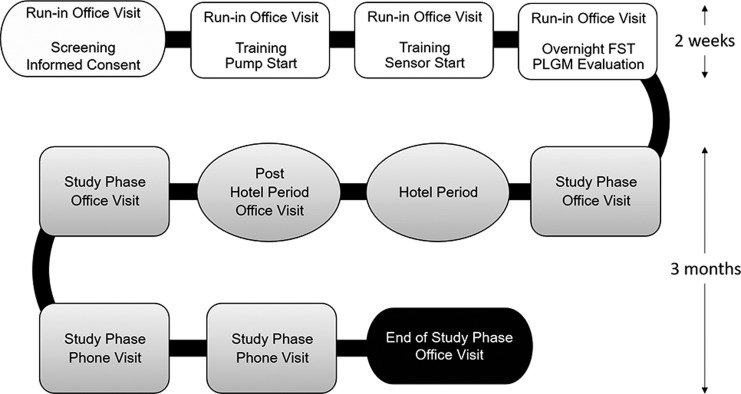
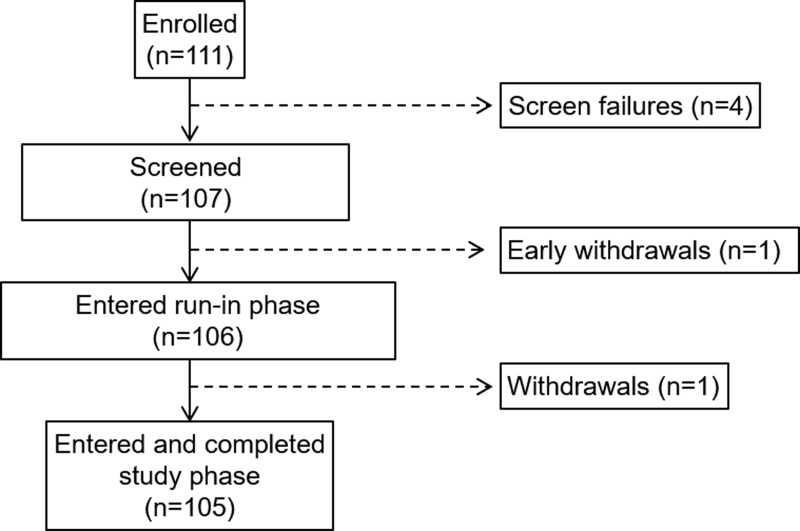
Methods: Participants (N = 105, ages 7-13 years, mean age 10.8 ± 1.8 years) were enrolled at nine centers (eight in the United States and one in Israel) and completed a 2-week baseline run-in phase in Manual Mode followed by a 3-month study phase with Auto Mode enabled. Sensor glucose (SG), glycated hemoglobin (HbA1c), percentage of SG values across glucose ranges, and SG variability, during the run-in and study phases were compared. Participants underwent frequent sample testing with i-STAT® venous reference measurement during a hotel period (6 days/5 nights) to evaluate the system's continuous glucose monitoring performance.
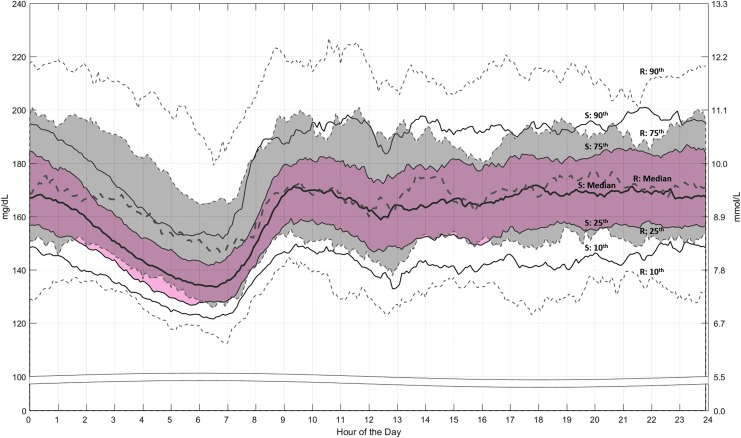
Results: Auto Mode was used a median of 81% of the time. From baseline to end of study, overall SG dropped by 6.9 ± 17.2 mg/dL (P < 0.001), HbA1c decreased from 7.9% ± 0.8% to 7.5% ± 0.6% (P < 0.001), percentage of time in target glucose range (70-180 mg/dL) increased from 56.2% ± 11.4% to 65.0% ± 7.7% (P < 0.001), and the SG coefficient of variation decreased from 39.6% ± 5.4% to 38.5% ± 3.8% (P = 0.009). The percentage of SG values within target glucose range was 68.2% ± 9.1% and that of i-STAT reference values was 65.6% ± 17.7%. The percentage of values within 20%/20 of the i-STAT reference was 85.2%. There were no episodes of severe hypoglycemia or diabetic ketoacidosis during the study phase.
Conclusion: In-home use of MiniMed 670G system Auto Mode for 3 months by children with T1D, similar to MiniMed 670G system use by adolescents and adults with T1D, was safe and associated with reduced HbA1c levels and increased time in target glucose range, compared with baseline.
Trial registration: ClinicalTrials.gov NCT02660827.
Keywords: Automated insulin delivery; Closed-loop insulin delivery; Glucose variability.; HbA; Pediatric; Type 1 diabetes.
Conflict of interest statement
G.P.F, O.P-H., D.R.L., D.I.S., T.S.B., B.W.B., M.A.W., B.A.B., and K.B.K. managed the study conducted at their individual investigational centers, contributed to the analysis and interpretation of results, and reviewed and edited the article. All of the principal investigators received research support and compensation from Medtronic to conduct the study. S.H., J.S., S.W.L., and F.R.K., employees of Medtronic, developed the study design, managed data analyses, and/or reviewed and edited the article. G.P.F., the guarantor of the work, had full access to all of the study data and, as such, takes responsibility for the integrity of the data and the accuracy of the data analysis.
Figures
References
-
- Feldman MA, Anderson LM, Shapiro JB, et al. Family-based interventions targeting improvements in health and family outcomes of children and adolescents with type 1 diabetes: a systematic review. Curr Diab Rep 2018;18:15. - PubMed
-
- Miller KM, Foster NC, Beck RW, et al. Current state of type 1 diabetes treatment in the US: updated data from the T1D Exchange clinic registry. Diabetes Care 2015;38:971–978 - PubMed
-
- Doyle EA, Weinzimer SA, Steffen AT, et al. A randomized, prospective trial comparing the efficacy of continuous subcutaneous insulin infusion with multiple daily injections using insulin glargine. Diabetes Care 2004;27:1554–1558 - PubMed
-
- Szypowska A, Schwandt A, Svensson J, et al. Insulin pump therapy in children with type 1 diabetes: analysis of data from the SWEET registry. Pediatr Diabetes 2016;17(Suppl. 23):38–45 - PubMed
Publication types
MeSH terms
Substances
Associated data
LinkOut - more resources
Full Text Sources
Medical
Miscellaneous
