. 2019 Feb 5;91(3):1838-1846.
doi: 10.1021/acs.analchem.8b03132. Epub 2019 Jan 10.

Peak Annotation and Verification Engine for Untargeted LC-MS Metabolomics

Affiliations

Peak Annotation and Verification Engine for Untargeted LC-MS Metabolomics

Lin Wang et al. Anal Chem. .

Abstract

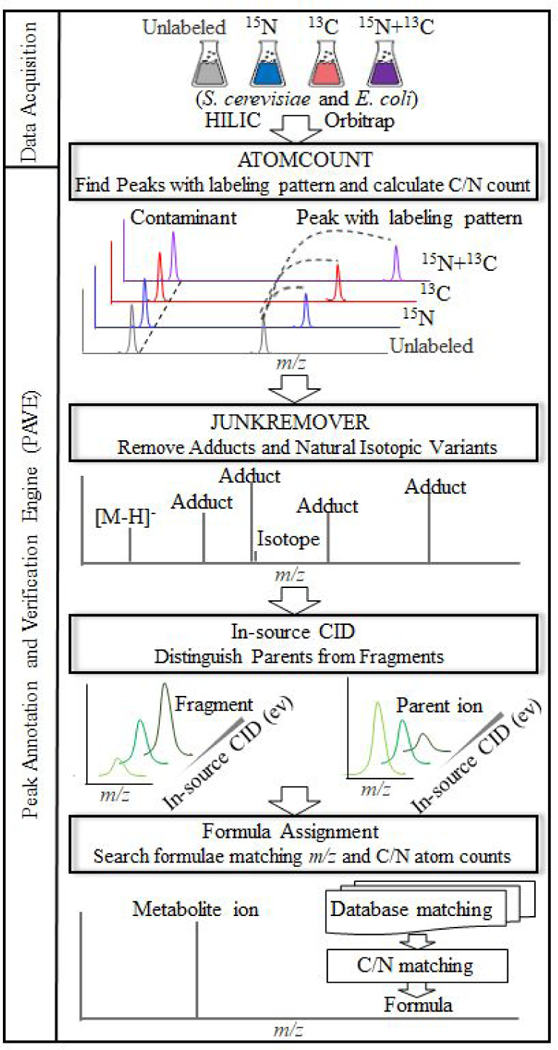
Untargeted metabolomics can detect more than 10 000 peaks in a single LC-MS run. The correspondence between these peaks and metabolites, however, remains unclear. Here, we introduce a Peak Annotation and Verification Engine (PAVE) for annotating untargeted microbial metabolomics data. The workflow involves growing cells in 13C and 15N isotope-labeled media to identify peaks from biological compounds and their carbon and nitrogen atom counts. Improved deisotoping and deadducting are enabled by algorithms that integrate positive mode, negative mode, and labeling data. To distinguish metabolites and their fragments, PAVE experimentally measures the response of each peak to weak in-source collision induced dissociation, which increases the peak intensity for fragments while decreasing it for their parent ions. The molecular formulas of the putative metabolites are then assigned based on database searching using both m/ z and C/N atom counts. Application of this procedure to Saccharomyces cerevisiae and Escherichia coli revealed that more than 80% of peaks do not label, i.e., are environmental contaminants. More than 70% of the biological peaks are isotopic variants, adducts, fragments, or mass spectrometry artifacts yielding ∼2000 apparent metabolites across the two organisms. About 650 match to a known metabolite formula based on m/ z and C/N atom counts, with 220 assigned structures based on MS/MS and/or retention time to match to authenticated standards. Thus, PAVE enables systematic annotation of LC-MS metabolomics data with only ∼4% of peaks annotated as apparent metabolites.


Figures

Figure 1.
Figure 1.
Flow chart for untargeted peak annotation by PAVE. S. cerevisiae and E. coli were grown in four conditions (unlabeled, 15N, 13C, and 15N+13C). Metabolites were analyzed by HILIC LC- high resolution MS. For each peak in the unlabeled sample, ATOMCOUNT computationally assesses whether the labeled samples show a logical pattern of signals, generating a list of candidate biological metabolites with known nitrogen and carbon atom counts (N and C, respectively). JUNKREMOVER then computationally differentiates metabolite ions from natural isotopic variants, adducts, and other artifacts. To discriminate between metabolite ions and fragments, all ions were subjected to a weak in-source CID energy, which increases the signal intensity for fragments while decreasing it for parent ions. The metabolite ions were then subjected to MS/MS in an effort to assign molecular structures based on database matching.
Figure 2.
Figure 2.
ATOMCOUNT. (A) Workflow. Every peak is assessed, one at a time, to determine whether it shows a logical labeling pattern for any choice of carbon atom count (C ≥ 1) and nitrogen atom count (N ≥ 0). (B) Idealized case (theoretical intensity pattern), where the unlabeled, carbon-labeled, nitrogen-labeled and dual labeled peaks all have the identical intensity. The entries in the matrix are peak intensities that are normalized to the peak intensity of the unlabeled sample. Zeroes in the matrix indicate the absence of unlabeled peaks in the labeled samples, and vice versa. (C) Example of peaks from environmental contaminants, the most common type of peaks found in the data. Note that the signal does not shift with labeling. (D) Example of biological peak at m/z 505.9882 for the candidate atom counts of N = 4 and C = 11; the correlation is weak because these are not the correct atom counts. (E) Example of the same biological peak at m/z 505.9882, for N = 5 and C = 10, matching the molecular formula of C10H16N5O13P3 (corresponding to ATP).
Figure 3.
Figure 3.
JUNKREMOVER for de-adducting, de-isotoping and filtering out peaks with too low C count for the mass. For each peak found by ATOMCOUNT, JUNKREMOVER assesses whether there is a lower molecular weight peak at the same RT where the mass difference, C and N atom counts, and relative peak intensities suggest that the peak at the lower molecular weight is the metabolite ion. (A and B) Glucose adducts annotation benefits from C/N count matching and searching for the (de)protonated metabolite ion also in the opposite ionization mode data (for glucose, the [M-H]- but not [M+H]+ ion is readily observed). In addition to the abundant adducts visible here, there are another ~45 less abundant glucose adducts (Table S10). (C and D) Molecular weight as a function of C count, for known metabolites from HMBD (gray dots) versus biological-derived peaks observed in S. cerevisiae (after de-adducting and de-isotoping) (blue and red dots). The black line defines the 99th percentile cutoff of known metabolites. Blue dots are retained peaks and red dots are discarded peaks.
Figure 4.
Figure 4.
Impact of in-source CID voltage on the intensity of parent ions and fragments. (A) Mass spectrum for glucose and its adducts and fragments at in-source CID energies of 0, 2, 4, 6, 10, 14, 20 eV. (B) Peak intensity at 2, 4, 6, 15 eV (compared to 0 eV) for 80 metabolite standards and their related fragments. The standards were dissolved in extraction buffer. Note that application of an in-source CID energy universally decreases the parent ion intensity, whereas a small (2 or 4 eV) in-source CID energy consistently increases fragment intensity.
Figure 5.
Figure 5.
Outcome of biological peak annotation by PAVE. (A, B) Annotation as a function of peak intensity (log10 intensity of 3 refers to all peaks with height between 103 to 104, etc.). (C) Venn diagram showing number of metabolites with assigned formulae (found in PAVE + 432 standards commonly tracked in our lab) across S. cerevisiae, E. coli and mouse liver. (D) Venn diagram showing number of metabolite ions found in PAVE but without assigned formulae across S. cerevisiae, E. coli and mouse liver.

References

    1. Wishart DS Emerging Applications of Metabolomics in Drug Discovery and Precision Medicine. Nature Reviews Drug Discovery 2016, 15 (7), 473–484. 10.1038/nrd.2016.32. - DOI - PubMed
    1. Gowda H; Ivanisevic J; Johnson CH; Kurczy ME; Benton HP; Rinehart D; Nguyen T; Ray J; Kuehl J; Arevalo B; et al. Interactive XCMS Online: Simplifying Advanced Metabolomic Data Processing and Subsequent Statistical Analyses. Analytical Chemistry 2014, 86 (14), 6931–6939. 10.1021/ac500734c. - DOI - PMC - PubMed
    1. Huan T; Forsberg EM; Rinehart D; Johnson CH; Ivanisevic J; Benton HP; Fang M; Aisporna A; Hilmers B; Poole FL; et al. Systems Biology Guided by XCMS Online Metabolomics. Nature Methods 2017, 14 (5), 461–462. 10.1038/nmeth.4260. - DOI - PMC - PubMed
    1. Smith CA; Want EJ; O’Maille G; Abagyan R; Siuzdak G XCMS: Processing Mass Spectrometry Data for Metabolite Profiling Using Nonlinear Peak Alignment, Matching, and Identification. Analytical Chemistry 2006, 78 (3), 779–787. 10.1021/ac051437y. - DOI - PubMed
    1. Katajamaa M; Miettinen J; Oresic M MZmine: Toolbox for Processing and Visualization of Mass Spectrometry Based Molecular Profile Data. Bioinformatics 2006, 22 (5), 634–636. 10.1093/bioinformatics/btk039. - DOI - PubMed

Publication types

LinkOut - more resources