. 2019 Feb 15;30(4):453-466.
doi: 10.1091/mbc.E18-02-0132. Epub 2018 Dec 26.

Ate1-mediated posttranslational arginylation affects substrate adhesion and cell migration in Dictyostelium discoideum

Affiliations

Ate1-mediated posttranslational arginylation affects substrate adhesion and cell migration in Dictyostelium discoideum

Petros Batsios et al. Mol Biol Cell. .

Abstract

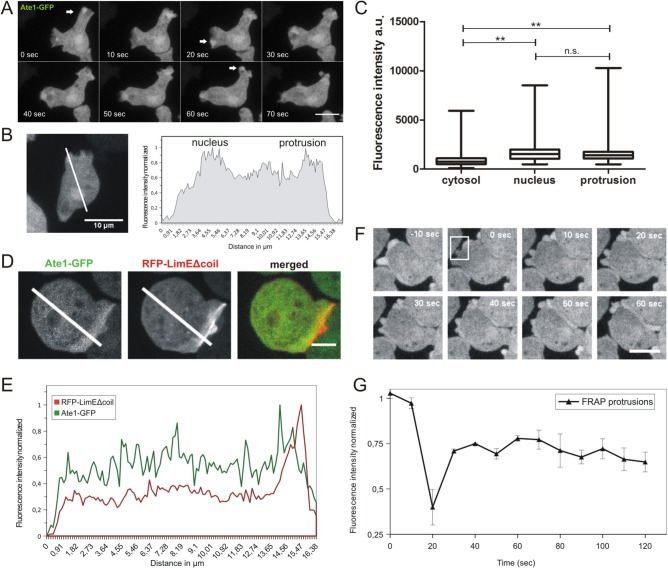
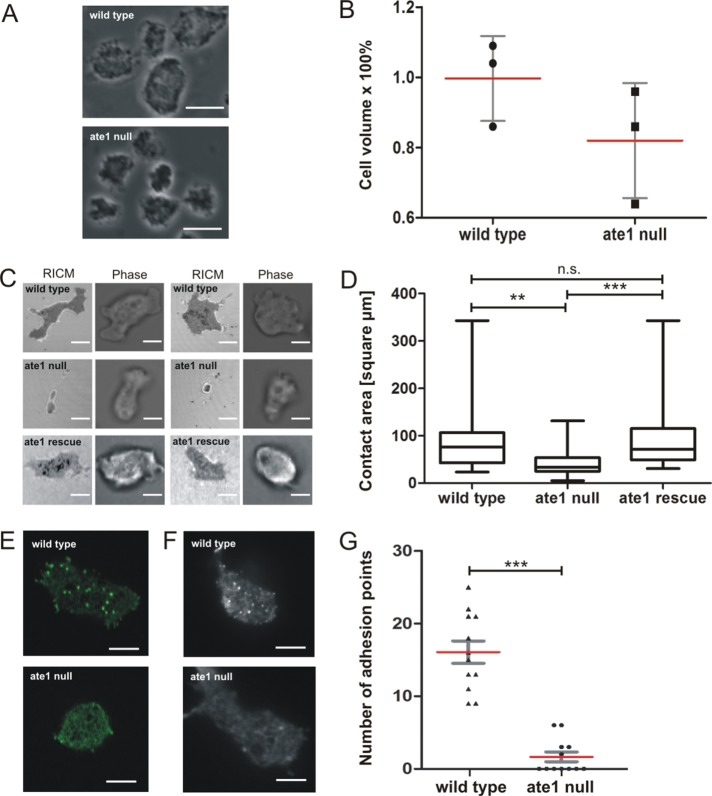
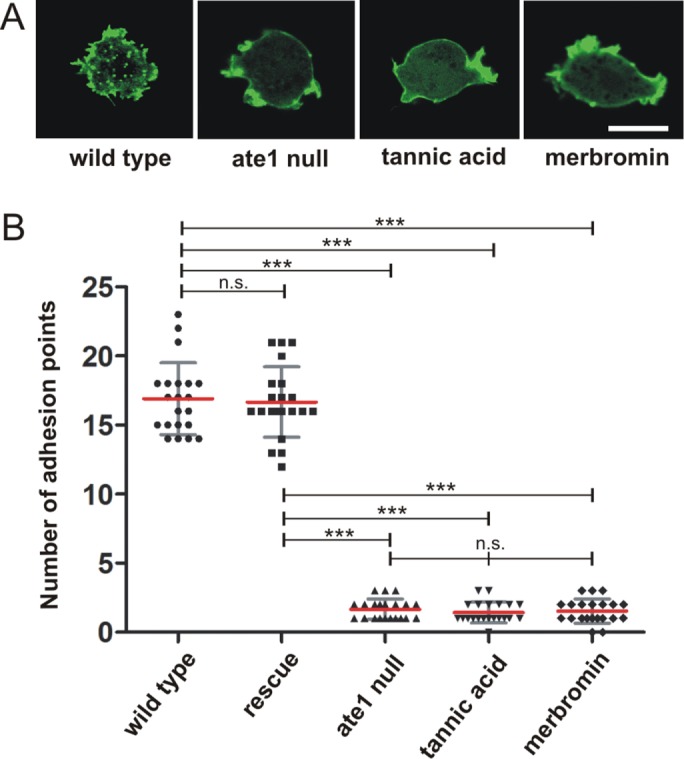
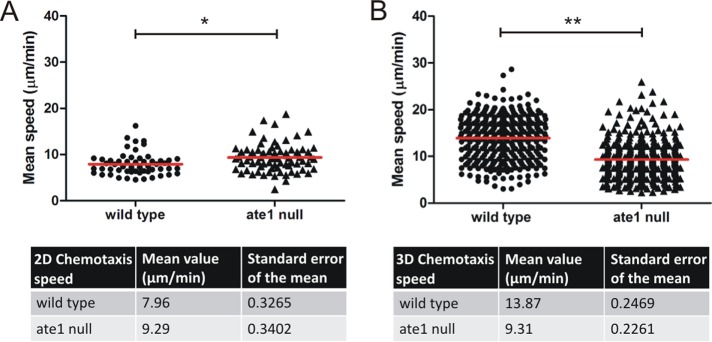
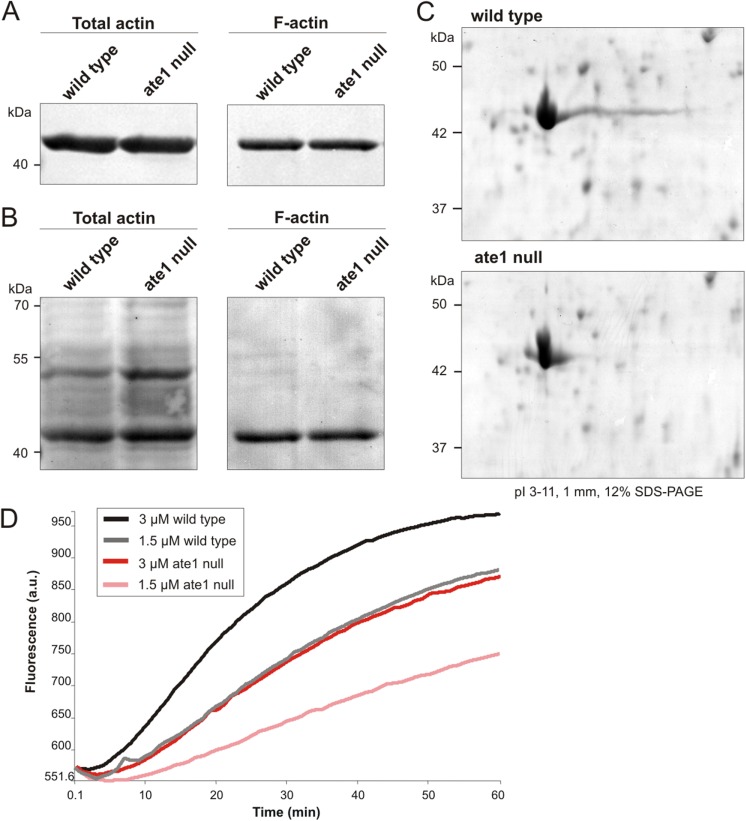
The highly conserved enzyme arginyl-tRNA-protein transferase (Ate1) mediates arginylation, a posttranslational modification that is only incompletely understood at its molecular level. To investigate whether arginylation affects actin-dependent processes in a simple model organism, Dictyostelium discoideum, we knocked out the gene encoding Ate1 and characterized the phenotype of ate1-null cells. Visualization of actin cytoskeleton dynamics by live-cell microscopy indicated significant changes in comparison to wild-type cells. Ate1-null cells were almost completely lacking focal actin adhesion sites at the substrate-attached surface and were only weakly adhesive. In two-dimensional chemotaxis assays toward folate or cAMP, the motility of ate1-null cells was increased. However, in three-dimensional chemotaxis involving more confined conditions, the motility of ate1-null cells was significantly reduced. Live-cell imaging showed that GFP-tagged Ate1 rapidly relocates to sites of newly formed actin-rich protrusions. By mass spectrometric analysis, we identified four arginylation sites in the most abundant actin isoform of Dictyostelium, in addition to arginylation sites in other actin isoforms and several actin-binding proteins. In vitro polymerization assays with actin purified from ate1-null cells revealed a diminished polymerization capacity in comparison to wild-type actin. Our data indicate that arginylation plays a crucial role in the regulation of cytoskeletal activities.


Figures

FIGURE 1:
FIGURE 1:
Comparison of DdAte1 with Ate1 proteins from different organisms. (A) Schematic organization of D. discoideum Ate1 in comparison to Ate1 proteins from other organisms. The black boxes indicate the conserved N- (Nt-Ate1 domain) and C-terminal (Ct-Ate1 domain) arginyltransferase homology domains. The sequences of D. discoideum and human Ate1 share an overall identity of 54%. Numbers indicate the length of the proteins in amino acid residues. (B) Phylogenetic tree of Ate1 proteins that were identified by blast searches at NCBI. The tree was computed with the constraint-based multiple sequence alignment tool COBALT (neighbor joining) at NCBI (Papadopoulos and Agarwala, 2007). The sequences used to compile the tree originate from diverse taxa, including monocots (light green; Triticum uratum [EMS49035], Aegilops tauschii [EMT26921], Oryza sativa [NP001055690]), eudicots (dark green; Arabidospsis thaliana [BAD44222], Arabidospsis lyrata [XP002873220]), worms (light blue; Caenorhabditis elegans [P90914]), amoebozoa (red; Dictyostelium fasciculatum [XP004357377], Polyspondylium pallidum [EFA83779], D. discoideum [XP647040], D. purpureum [XP_003285818]), mammals (blue; Mus musculus Isoform 1 [NP_038827.2], M. musculus Isoform 2 [NP_001258272.1], M. musculus Isoform 3 [NP_001025066.1], M. musculus Isoform 4 [NP_001129526.1], Bos mutus [ELR60396.1], Homo sapiens Isoform 1 [NP_001001976], H. sapiens Isoform 2 [NP_008972], H. sapiens Isoform 3 [NP_001275663], H. sapiens Isoform 4 [NP_001275664], H. sapiens Isoform 5 [NP_001275665]), flies (orange; Drosophila simulans [XP_002082298], Drosophila sechellia [XP002034657], Drosophila melanogaster [AAL83965], Drosophila ananasae [XP_001960010]), and yeast (pink; Saccharomyces cerevisiae [P16639]). (C) Structural predictions for Ate1 proteins from mouse (M. musculus (Isoform 1) [NP_038827.2]), D. sechellia [XP002034657], and D. discoideum [XP647040]). The predicted extensions within the arginyltransferase domain are indicated in light blue. The unique C-terminal part of D. discoideum Ate1 (red, amino acid residues 548–629) most probably does not interfere with the exposed active site of the enzyme. (D) Active sites of Ate1 modeled proteins from mouse, D. sechellia, and D. discoideum are highlighted. The exposed active sites in the first globular domain are very well conserved. The four cysteine residues relevant for the enzymatic activity are exposed at the outer face of the protein.
FIGURE 2:
FIGURE 2:
Subcellular localization of DdAte1. (A) DdAte1-GFP expressing cells were recorded by live-cell spinning disk confocal microscopy. DdAte1-GFP localizes to the cytoplasm and is enriched in nuclei and in the cell cortex during the formation of pseudopodia. (B) Live-cell spinning disk confocal microscopy of a DdAte1-GFP expressing cell (left). The intensity profile along the line is plotted (right). The fluorescent signal is stronger in the nucleus and cortical pseudopodia. (C) Fluorescence intensity of DdAte1-GFP in the cytosol, nucleus, and protrusions. Fluorescence intensities of the region of interest were measured with ImageJ within a 4 × 4 square pixel area (0.251 μm2) for n = 54 cells. Fluorescence intensity in protrusions and nuclei showed an enrichment compared with the cytosol. For the statistical analysis, GraphPad Prism Software employing one-way analysis of variance (ANOVA) was used. There is no significance difference between nucleus and protrusion (ns), whereas differences of cytosol versus nucleus and cytosol versus protrusions are significant (p < 0.0097) (**). Bars are ±SD. (D) Live-cell spinning disk confocal microscopy of a Dictyostelium cell expressing both DdAte1-GFP and RFP-LimEΔcoil. (E) The intensity profiles of both fluorescence channels along the lines in D are plotted. (F) Selected time points of a representative FRAP experiment at the protrusion of DdAte1-GFP expressing cells (Supplemental Movie 1). The fluorescence in a protrusion (within the white square at time point 0 s) was bleached with a point-focused 473-nm laser pulse. Spinning disk confocal microscopy images with a time-lapse acquisition rate of six stacks per minute and a maximum intensity projection of five slices per image stack are shown. (G) DdAte1-GFP in protrusions shows a high exchange rate. The graph shows recovery kinetics from three independent measurements performed using a spinning disk microscope (mean ± SD). Scale bars, 5 μm in A, D, and F; 10 µm in B.
FIGURE 3:
FIGURE 3:
The analysis of ate1-null cells reveals that substrate contact areas of mutant cells are much smaller and lack actin-containing adhesion points. (A) Phase-contrast microscopy images of live cells showing that ate1-null cells are smaller in comparison to wild-type cells (compare also to Supplemental Figure S3C). Scale bar, 10 μm. (B) Determination of the average cell volume of wild-type and ate1-null cells as described under Materials and Methods revealed that the cell volume of ate1-null cells is ∼ 20% smaller than the volume of the wild type. The experiment was repeated three times. Each value corresponds to the average of 5 × 10⁶ cells. (C) RICM revealed that ate1-null cells are much less adhesive to glass surfaces. Wild-type and mutant cells were plated on glass coverslips and tracked for 100 frames in 10-s intervals. Scale bars, 5 µm. (D) The contact area for every cell was measured using ImageJ. From these data, the maximal contact area was calculated for wild-type (n = 27), ate1-null (n = 57), and rescue (n = 39) cells. The area of adhesion to the substrate of ate1-null cells is 40% smaller than the area of wild-type cells. (E) Confocal microscopy of GFP-LimEΔcoil expressing wild-type and ate1-null cells. Scale bars, 5 µm. (F) TIRF microscopy of wild-type and ate1-null cells expressing GFP-LimEΔcoil. Scale bars, 5 µm. (G) Quantification of adhesion points in wild-type (n = 12) and ate1-null (n = 12) cells. The quantification revealed a significant decrease of adhesion points in ate1-null compared with wild-type cells. For the statistical analysis, one-way ANOVA-Tukey’s multiple comparison test was used for D, unpaired t test for B and G. ** and *** p < 0.0001, p < 0.05 was considered significant. The red lines indicate mean values.
FIGURE 4:
FIGURE 4:
Small molecule inhibitors mimic the ate1-null phenotype. (A) Wild-type cells expressing GFP-LimEΔcoil were treated with 30 µM tannic acid or 50 µM merbromin for 24 h. Untreated wild-type, ate1-null, and inhibitor-treated wild-type cells (tannic acidic or merbromin) expressing GFP-LimEΔcoil were recorded by confocal microscopy, and the actin focal adhesion dots were counted and quantified as displayed in B. Scale bar, 10 µm. (B) Adhesion point quantification was conducted manually using the LSM Image Examiner. Ate1-null and inhibitor-treated cells showed a significant decrease of adhesion points compared with wild-type cells (n = 21 for all groups). One-way ANOVA-Tukey’s multiple comparison test revealed significant differences of ate1-null and inhibitor-treated cells versus wild-type and Ate1-GFP rescue cells as shown in the graph. ***p < 0.0001. Differences between wild-type and rescue cells were not significant (ns); p < 0.05 was considered significant. Error bars are ±SD.
FIGURE 5:
FIGURE 5:
Increased migration speed of ate1-null cells in under-agar folate chemotaxis. (A) Random motility was determined for growth-phase wild-type and ate1-nulls attached to a glass surface without a chemotactic stimulus. (B) Under-agarose assays of growth-phase wild-type and ate1-null cells were performed in low 35-mm standard-bottom µ-dishes (Ibidi) as described in Materials and Methods. Ate1-null cells move faster than wild-type cells showing a significant increase in cell speed. Straightness and directionality are decreased in cells lacking Ate1. ***p < 0.0001 and *p = 0.0227, respectively; p < 0.05 was considered significant. The red lines indicate the mean of speed, straightness, or directionality.
FIGURE 6:
FIGURE 6:
Chemotaxis of aggregation-competent ate1-null cells is impaired in three-dimensional compared with two-dimensional environments. Ate1-null cells expressing GFP-LimΔcoil were starved together with wild-type cells expressing Cherry-LimEΔcoil. (A) The migratory behavior of wild-type cells expressing Cherry-LimΔcoil (n = 54), and ate1-null expressing GFP-LimΔcoil cells (n = 74) was analyzed in a two-dimensional chemotaxis micropipette assay toward cAMP. The average speed of ate1-null cells was significantly higher than the average speed of wild-type cells. *p = 0.0045. The data from four individual experiments were averaged. (B) Migration speed analyzed during three-dimensional chemotaxis conditions using µ-Slide Chemotaxis3D chambers (Ibidi). In three-dimensional environments, ate1-null cells (n = 342) migrated significantly slower than wild-type cells (n = 342) toward cAMP. **p < 0.0001. The speed was analyzed using the Bitmap Imaris Software. The red lines indicate the mean speed; p < 0.05 was considered significant.
FIGURE 7:
FIGURE 7:
Actin isolated from ate1-null cells reveals different isoelectric properties and lower polymerization capacity in comparison to actin from wild type. (A) Triton-insoluble cytoskeletons were extracted from wild-type and ate1-null cells and subjected to Western blot analysis using anti-actin antibodies. The amount of F-actin in the Triton-insoluble cytoskeleton of ate1-null cells is comparable to wild type. (B) Protein transfer shown in A was controlled by Ponceau S staining. (C) Lysates prepared from wild-type and ate1-null cells were separated by two-dimensional PAGE, and proteins were stained with Coomassie Brilliant blue. The overall appearance of actin isoforms is nearly the same in wild-type and ate1-null cells, but ate1-null cells lack the long basic tail of the major actin isoforms. (D) Actin polymerization assays using actin isolated from wild-type or ate1-null cells and 10% pyrenylated actin.

References

    1. Arnold K, Bordoli L, Kopp J, Schwede T. (2006). The SWISS-MODEL workspace: a web-based environment for protein structure homology modelling. Bioinformatics , 195–201. - PubMed
    1. Axelrod D. (2003). Total internal reflection fluorescence microscopy in cell biology. Methods Enzymol , 1–33. - PubMed
    1. Balzi E, Choder M, Chen WN, Varshavsky A, Goffeau A. (1990). Cloning and functional analysis of the arginyl-tRNA-protein transferase gene ATE1 of Saccharomyces cerevisiae. J Biol Chem , 7464–7471. - PubMed
    1. Bohley P, Kopitz J, Adam G, Rist B, von Appen F, Urban S. (1991). Post-translational arginylation and intracellular proteolysis. Biomed Biochim Acta , 343–346. - PubMed
    1. Bretschneider T, Anderson K, Ecke M, Müller-Taubenberger A, Schroth-Diez B, Ishikawa-Ankerhold HC, Gerisch G. (2009). The three-dimensional dynamics of actin waves, a model of cytoskeletal self-organization. Biophys J , 2888–2900. - PMC - PubMed

Publication types

MeSH terms

LinkOut - more resources