. 2018 Dec 26;14(12):e1007872.
doi: 10.1371/journal.pgen.1007872. eCollection 2018 Dec.

Walking along chromosomes with super-resolution imaging, contact maps, and integrative modeling

Affiliations

Walking along chromosomes with super-resolution imaging, contact maps, and integrative modeling

Guy Nir et al. PLoS Genet. .

Abstract

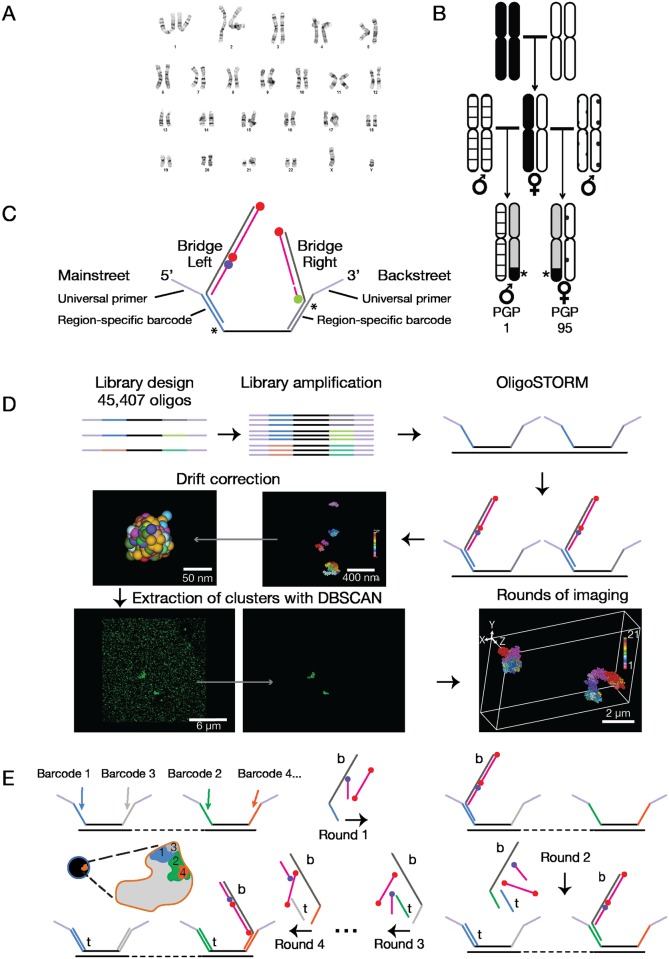
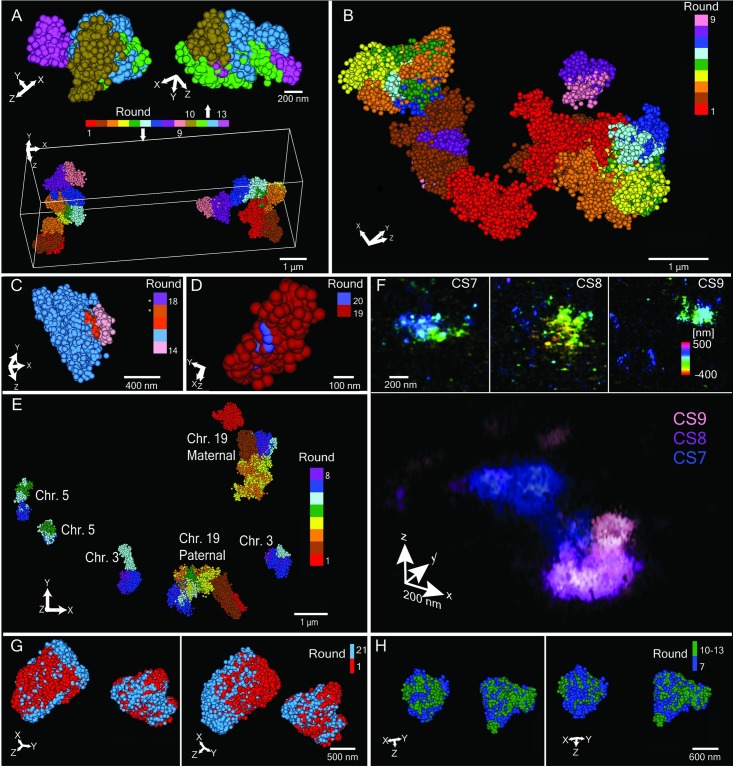
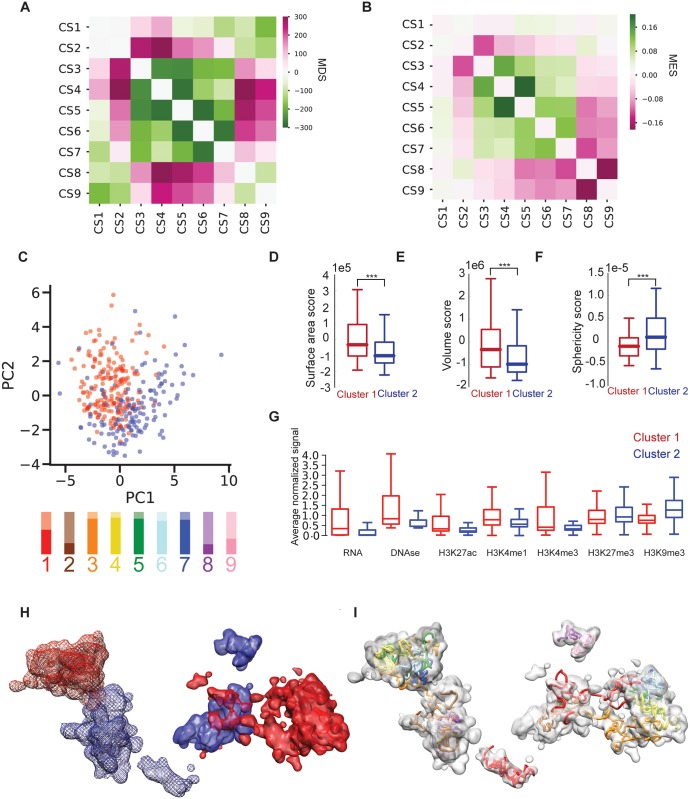
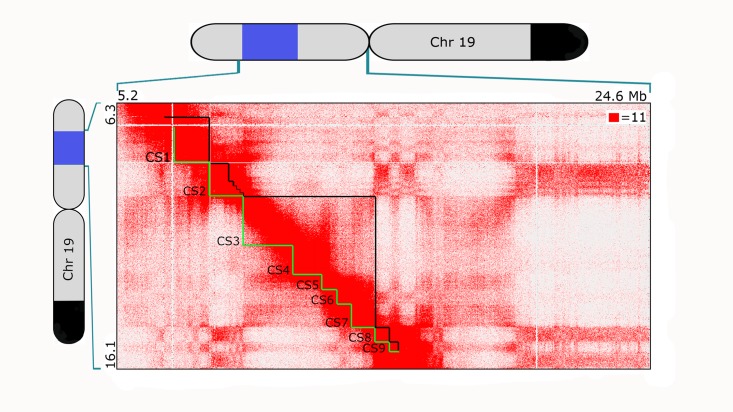
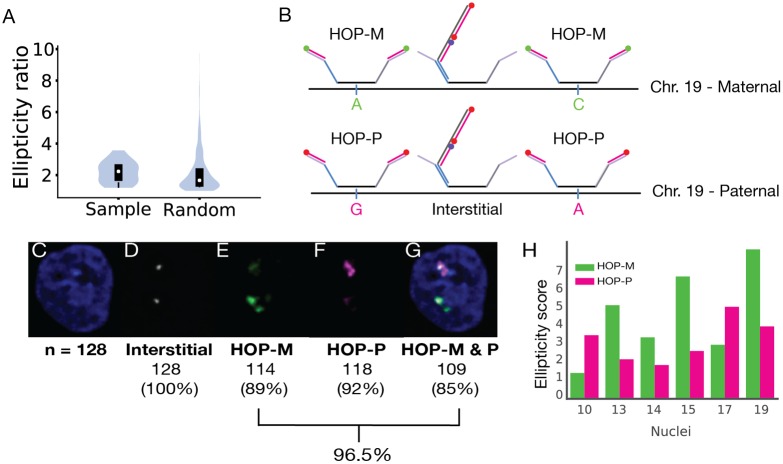
Chromosome organization is crucial for genome function. Here, we present a method for visualizing chromosomal DNA at super-resolution and then integrating Hi-C data to produce three-dimensional models of chromosome organization. Using the super-resolution microscopy methods of OligoSTORM and OligoDNA-PAINT, we trace 8 megabases of human chromosome 19, visualizing structures ranging in size from a few kilobases to over a megabase. Focusing on chromosomal regions that contribute to compartments, we discover distinct structures that, in spite of considerable variability, can predict whether such regions correspond to active (A-type) or inactive (B-type) compartments. Imaging through the depths of entire nuclei, we capture pairs of homologous regions in diploid cells, obtaining evidence that maternal and paternal homologous regions can be differentially organized. Finally, using restraint-based modeling to integrate imaging and Hi-C data, we implement a method-integrative modeling of genomic regions (IMGR)-to increase the genomic resolution of our traces to 10 kb.


Conflict of interest statement

I have read the journal’s policy and the authors of this manuscript have the following competing interests: C-tW, BJB, RBM, SCN, SC, and HQN hold or have patent filings pertaining to Oligopaints and related technologies, including other oligo-based methods for imaging. These technologies may be licensed to ReadCoor, a company in which C-tW holds equity. PY and BJB have filed patents related to DNA-PAINT. DNA-PAINT technology has been licensed to Ultivue Inc., a company in which PY is an equity holder and cofounder. PY is also a co-founder of NuProbe Global.

Figures

Fig 1
Fig 1. Tools.
(A) PGP1f karyotype (Methods). (B) Assignment of parental origin to homologs of chromosome 19 through pedigree analysis. Black and white, homologs of chromosome 19 in maternal parent of PGP1 and PGP95; patterned, homologs of paternal parents; asterisk and black, large SNV block shared between PGP1 and PGP95 identifying maternal homolog; grey, maternally derived regions without large SNV blocks shared by PGP1 and PGP95. (C) Oligopaint oligos (129–135 nts) consist of a segment of genomic homology (black; 35–41 nts) flanked by Mainstreet and Backstreet (47 nts), each consisting of universal primers (violet; 20 nts), region-specific barcodes (blue and grey; 20 nt), and 7-nt sequences (asterisks) which, in combination with barcodes, generate binding sites for toehold oligos. A bridge oligo (left) bound to a Mainstreet barcode allows labeled secondary oligos (blue, Alexa Fluor 405; red, Alexa Fluor 647) to co-localize and enable OligoSTORM. A bridge (right) bound to a Backstreet barcode allows a labeled imager strand (green, Cy3B) to bind transiently, enabling OligoDNA-PAINT. (D) Workflow from library design through probe generation, OligoSTORM, drift correction using 90 nm fiducial markers, extraction of clusters with DBSCAN, and image assembly, as described in the text. (E) Walking along chromosomes using sequential hybridizations. All Oligopaint oligos are hybridized to the genome at once, and then rounds of hybridization and imaging are conducted. Each round brings in bridges (‘b’), labeled secondary oligos, and, except for round 1, toehold oligos (‘t’) in order to label a new region of the walk while removing labeled oligos from the previously imaged region.
Fig 2
Fig 2. Tracing PGP1f chromosomes.
(A) OligoSTORM image of a diploid nucleus showing CS1-9 (Bottom, rounds 1 through 9; 1.28, 1.24, 1.80, 1.04, 0.56, 0.52, 0.84, 0.52, and 0.36 Mb, respectively) and four subregions of CS7 (top, rounds 10 through 13; 140, 260, 350, and 90 kb, respectively) of both homologs. In this and all panels excepting F, radius of spheres represents the localization precision in the axial dimension. Note, the coordinates of the four subregions, selected based on the IMR-90 Hi-C map, correspond well to contact domains. Sequencing depth of the PGP1f Hi-C map was not, however, able to confirm these as contact domains in PGP1f, and thus they are referred to simply as subregions. (B) Same as in A with respect to CS1-9, but a different nucleus. (C) Loop (290 kb), including loop anchors (rounds 14 and 16; pink and orange; 10 kb each) and loop body (round 15; blue; 270 kb); *, we also imaged the upstream and downstream regions flanking the loop (rounds 17 and 18; 20 and 80 kb, respectively), but these are not shown so that the structure of the loop can be more apparent. (D) DNMT1 gene (round 19; 59.5 kb) and its DMR (round 20; 2.9 kb). (E) Walking along chromosome 19 in variable step sizes (see A) while also walking along chromosomes 3 and 5 in uniform step sizes (500 and 250 kb, respectively). (F) OligoDNA-PAINT images of CS7-9 of one homolog showing each chromosomal segment by itself (top; color scale represents depth in z) or merged (bottom; color scale represents different chromosomal segments). In contrast to other panels, localizations are blurred according to precision. (G) Superimposition of two images, taken 90 hours apart, each of both homologs of CS1 in (red, first image; blue, later image). Average overlap is 80 ± 9% and 68 ± 12% (n = 20) when images are aligned based on their centers of mass (left) or not (right), respectively. (H) Superimposition of two images from one nucleus of both homologs of CS7, one image encompassing all of CS7 (blue) and the other being a composite of the four subregions (green; 140, 260, 350, and 90 kb) comprising CS7. With alignment based on centers of mass, 85% of the single image overlapped the composite image, and 76% of the latter overlapped the former (left). Without alignment, the analogous values were 84% and 75% (right).
Fig 3
Fig 3. Image analysis and integrative modeling.
(A, B) Matrices for (A) mean spatial distance scores (MDS) and (B) mean entanglement scores (MES) for CS1-9. (C) Unsupervised PCA of 3D features for the 342 visualized chromosomal segments suggests two major clusters. Score plot for chromosomal segments color-coded by cluster type: cluster 1 in red and cluster 2 in blue. Lower panel, proportion of images of each chromosomal segment in cluster 1 (opaque color) or cluster 2 (transparent color); the chromosomal segments are colored as in Fig 2A and 2B. (D-F) Variation and distribution of the two clusters in terms of (D) surface area, (E) volume, and (F) sphericity scores are shown as box plots, where boundaries represent 1st and 3rd quartiles, middle line represents median, and whiskers extend to 1.5 times the interquartile range (Mann-Whitney rank test, ***: p < 10−3). (G) Mean normalized signal for RNA-seq (RNA), DNase I hypersensitive sites (DNase), and epigenetic modifications in PGP1f nuclei for the two identified clusters. Red, cluster 1; blue, cluster 2. (H) Density map of the 9 chromosomal segments for both copies spanning the entire 8.16 Mb region in a single PGP1f nucleus (same as that shown in Fig 2B) as imaged by OligoSTORM, color-coded by cluster type. Red, cluster 1; blue, cluster 2. One homolog is displayed with a solid surface, while the other homolog is displayed with a mesh surface. Note spatial segregation of clusters. (I) Density map (gray) representation of CS1-9 as in H except displayed, here, with the fitted 3D model obtained via IMGR (colored coded as in Figs 2A and 3B). Images were created with Chimera (Methods).
Fig 4
Fig 4. In situ Hi-C map of CS1-9 in PGP1f.
Hi-C map of region including CS1-9, displayed at 25 kb resolution. (See Methods for data processing and normalization.) Contact count indicated by the color of each pixel, ranging from 0 (white) to 11 (red); OligoSTORM steps (CS1-9) delineated in green below the diagonal, and compartmental intervals delineated in black above the diagonal. Cartoons of chromosome 19 show extent of the 8.16 Mb imaged region (blue) and block of SNVs shared between PGP1 and PGP95 (black; as in Fig 1B).
Fig 5
Fig 5. Homolog-specific Oligopaints for PGP1f.
(A) Violin plots of the ratios of 19 pairs of ellipticity scores, each pair representing the two homologs of one of the 19 imaged nuclei (Sample) or of 1,000 pairs of ellipticity scores, each pair representing two chromosomes chosen at random from the 38 representing the 19 imaged nuclei (Random). Boundaries of the black box-plot represent 1st and 3rd quartiles, white dot represents the median, and whiskers extend to 1.5 times the interquartile range (Mann-Whitney rank test, *: p < 10−2). (B) The HOP-M and HOP-P probes for chromosome 19 each encompass the entire chromosome and contain 11,259 oligos that cover ≥ 1 SNV per oligo. Thus, they are in contrast to Oligopaint oligos used to image CS1-9, these latter probes being “interstitial” in nature, as they avoid SNVs. HOP-M and HOP-P probes are visualized with secondary oligos labeled with different dyes, such that the two probes can be distinguished. (C-G) Images of a nucleus visualized with DAPI (C, blue), an interstitial probe targeting just CS3 (D, grey), HOP-M (E, green, Atto488N), HOP-P (F, magenta, Atto565N), and all probes (G), the latter demonstrating co-localization of all signals (n = 128); percentages show efficiency of each probe configuration, with a combined efficiency of 96.5%. (H) Ellipticity for the maternal (green) and paternal (magenta) homologs of the 6 nuclei for which HOPs had been applied.

References

    1. Cullen KE, Kladde MP, Seyfred MA. Interaction between transcription regulatory regions of prolactin chromatin. Science. 1993;261(5118):203–6. - PubMed
    1. Dekker J, Rippe K, Dekker M, Kleckner N. Capturing chromosome conformation. Science. 2002;295(5558):1306–11. 10.1126/science.1067799 - DOI - PubMed
    1. Lieberman-Aiden E, van Berkum NL, Williams L, Imakaev M, Ragoczy T, Telling A, et al. Comprehensive mapping of long-range interactions reveals folding principles of the human genome. Science. 2009;326(5950):289–93. 10.1126/science.1181369 - DOI - PMC - PubMed
    1. Dixon JR, Selvaraj S, Yue F, Kim A, Li Y, Shen Y, et al. Topological domains in mammalian genomes identified by analysis of chromatin interactions. Nature. 2012;485(7398):376–80. 10.1038/nature11082 - DOI - PMC - PubMed
    1. Kalhor R, Tjong H, Jayathilaka N, Alber F, Chen L. Genome architectures revealed by tethered chromosome conformation capture and population-based modeling. Nature Biotechnol. 2012;30(1):90. - PMC - PubMed

Publication types