

Time series modeling of pertussis incidence in China from 2004 to 2018 with a novel wavelet based SARIMA-NAR hybrid model
- PMID: 30586416
- PMCID: PMC6306235
- DOI: 10.1371/journal.pone.0208404
Time series modeling of pertussis incidence in China from 2004 to 2018 with a novel wavelet based SARIMA-NAR hybrid model
Abstract
Background: It is a daunting task to discontinue pertussis completely in China owing to its growing increase in the incidence. While basic to any formulation of prevention and control measures is early response for future epidemic trends. Discrete wavelet transform(DWT) has been emerged as a powerful tool in decomposing time series into different constituents, which facilitates better improvement in prediction accuracy. Thus we aim to integrate modeling approaches as a decision-making supportive tool for formulating health resources.
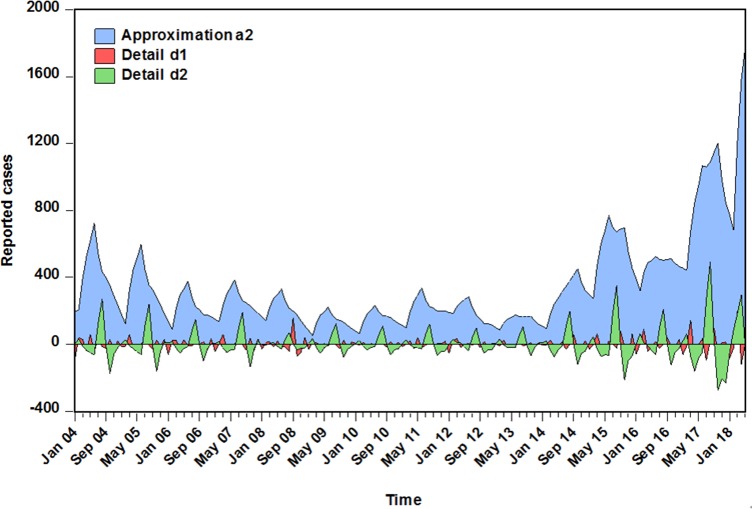
Methods: We constructed a novel hybrid method based on the pertussis morbidity cases from January 2004 to May 2018 in China, where the approximations and details decomposed by DWT were forecasted by a seasonal autoregressive integrated moving average (SARIMA) and nonlinear autoregressive network (NAR), respectively. Then, the obtained values were aggregated as the final results predicted by the combined model. Finally, the performance was compared with the SARIMA, NAR and traditional SARIMA-NAR techniques.
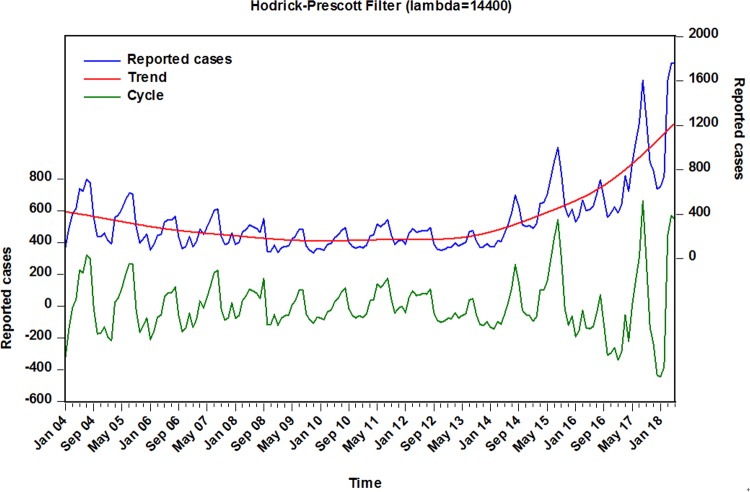
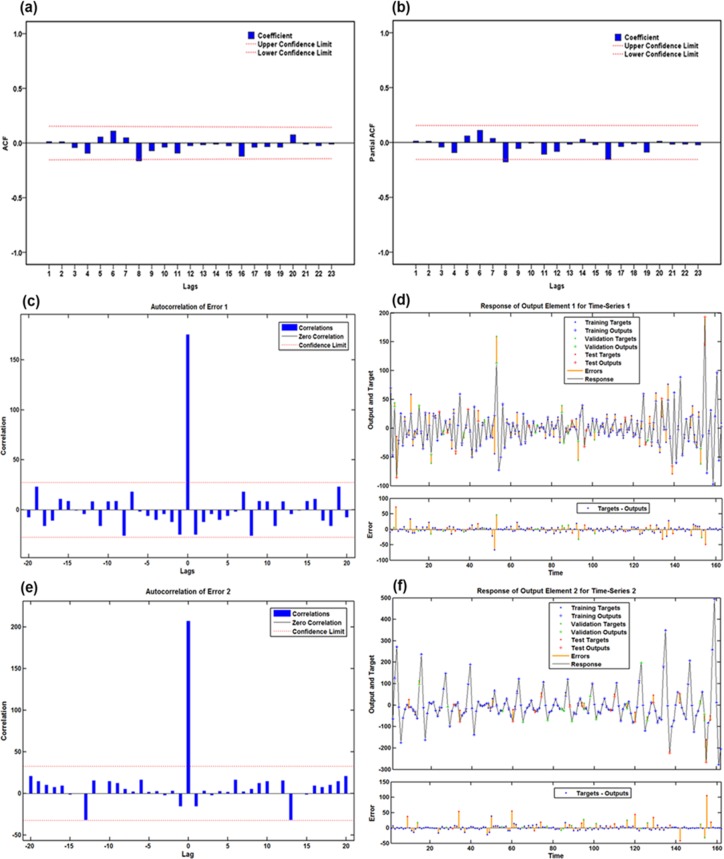
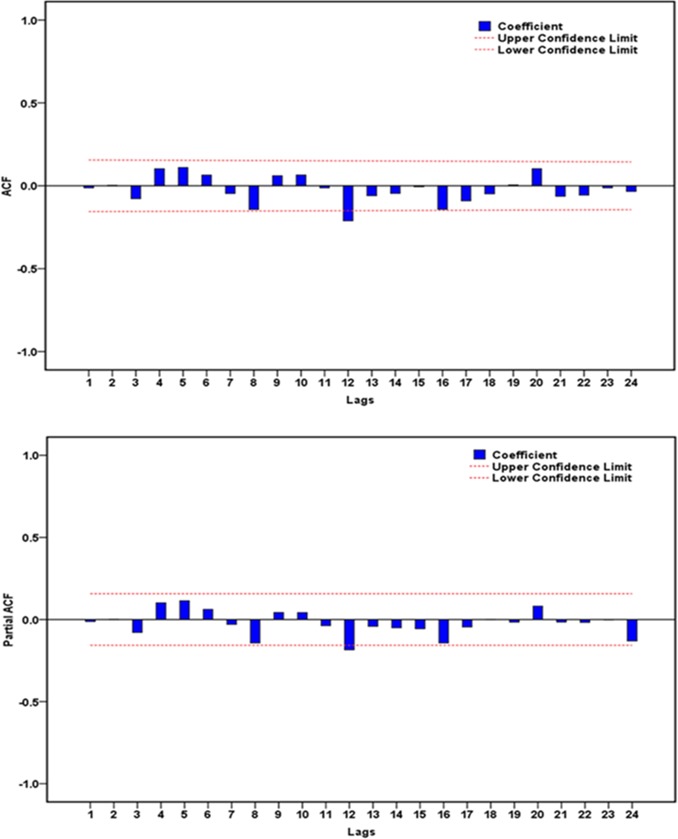
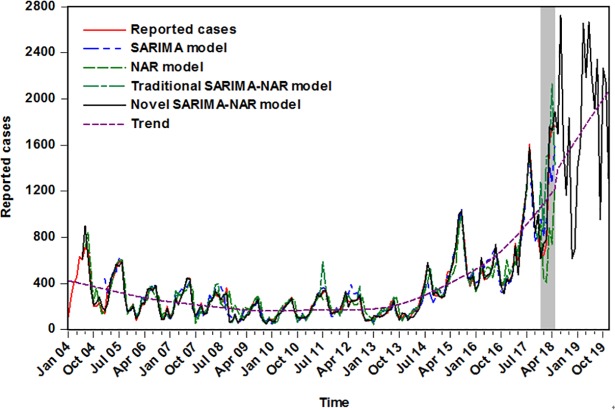
Results: The hybrid technique at level 2 of db2 wavelet including a SARIMA(0,1,3)(1,0,0)12modelfor the approximation-forecasting and NAR model with 12 hidden units and 4 delays for the detail d1-forecasting, along with another NAR model with 11 hidden units and 5 delays for the detail d2-forecasting notably outperformed other wavelets, SARIMA, NAR and traditional SARIMA-NAR techniques in terms of the mean square error, root mean square error, mean absolute error and mean absolute percentage error. Descriptive statistics exhibited that a substantial rise was observed in the notifications from 2013 to 2018, and there was an apparent seasonality with summer peak. Moreover, the trend was projected to continue upwards in the near future.
Conclusions: This hybrid approach has an outstanding ability to improve the prediction accuracy relative to the others, which can be of great help in the prevention of pertussis. Besides, under current trend of pertussis morbidity, it is required to urgently address strategically within the proper policy adopted.
Conflict of interest statement
The authors have declared that no competing interests exist.
Figures
Similar articles
-
Forecasting hand-foot-and-mouth disease cases using wavelet-based SARIMA-NNAR hybrid model.PLoS One. 2021 Feb 5;16(2):e0246673. doi: 10.1371/journal.pone.0246673. eCollection 2021. PLoS One. 2021. PMID: 33544752 Free PMC article.
-
Seasonality and trend prediction of scarlet fever incidence in mainland China from 2004 to 2018 using a hybrid SARIMA-NARX model.PeerJ. 2019 Jan 17;7:e6165. doi: 10.7717/peerj.6165. eCollection 2019. PeerJ. 2019. PMID: 30671295 Free PMC article.
-
Temporal trends analysis of tuberculosis morbidity in mainland China from 1997 to 2025 using a new SARIMA-NARNNX hybrid model.BMJ Open. 2019 Jul 31;9(7):e024409. doi: 10.1136/bmjopen-2018-024409. BMJ Open. 2019. PMID: 31371283 Free PMC article.
-
Application of a combined model with seasonal autoregressive integrated moving average and support vector regression in forecasting hand-foot-mouth disease incidence in Wuhan, China.Medicine (Baltimore). 2019 Feb;98(6):e14195. doi: 10.1097/MD.0000000000014195. Medicine (Baltimore). 2019. PMID: 30732135 Free PMC article.
-
Time-dependent spectral analysis of epidemiological time-series with wavelets.J R Soc Interface. 2007 Aug 22;4(15):625-36. doi: 10.1098/rsif.2007.0212. J R Soc Interface. 2007. PMID: 17301013 Free PMC article. Review.
Cited by
-
Modelling and forecasting of growth rate of new COVID-19 cases in top nine affected countries: Considering conditional variance and asymmetric effect.Chaos Solitons Fractals. 2021 Oct;151:111227. doi: 10.1016/j.chaos.2021.111227. Epub 2021 Jul 8. Chaos Solitons Fractals. 2021. PMID: 34253942 Free PMC article.
-
Multivariate Tail Probabilities: Predicting Regional Pertussis Cases in Washington State.Entropy (Basel). 2021 May 27;23(6):675. doi: 10.3390/e23060675. Entropy (Basel). 2021. PMID: 34072055 Free PMC article.
-
Trend analysis and prediction of gonorrhea in mainland China based on a hybrid time series model.BMC Infect Dis. 2024 Jan 22;24(1):113. doi: 10.1186/s12879-023-08969-4. BMC Infect Dis. 2024. PMID: 38253998 Free PMC article.
-
Forecasting waved daily COVID-19 death count series with a novel combination of segmented Poisson model and ARIMA models.J Appl Stat. 2021 Oct 12;50(11-12):2561-2574. doi: 10.1080/02664763.2021.1976119. eCollection 2023. J Appl Stat. 2021. PMID: 37529559 Free PMC article.
-
Forecasting hand-foot-and-mouth disease cases using wavelet-based SARIMA-NNAR hybrid model.PLoS One. 2021 Feb 5;16(2):e0246673. doi: 10.1371/journal.pone.0246673. eCollection 2021. PLoS One. 2021. PMID: 33544752 Free PMC article.
References
-
- World Health Organization. Available:http://www.who.int/immunization/monitoring_surveillance/burden/vpd/surve.... Accessed 2018 September 12.
Publication types
MeSH terms
LinkOut - more resources
Full Text Sources
Medical
