Comparative Study
. 2019 Jan 22;139(4):502-517.
doi: 10.1161/CIRCULATIONAHA.118.036157.

Endothelial Hypoxia-Inducible Factor-2α Is Required for the Maintenance of Airway Microvasculature

Affiliations
Comparative Study

Endothelial Hypoxia-Inducible Factor-2α Is Required for the Maintenance of Airway Microvasculature

Xinguo Jiang et al. Circulation. .

Abstract

Background: Hypoxia-inducible factors (HIFs), especially HIF-1α and HIF-2α, are key mediators of the adaptive response to hypoxic stress and play essential roles in maintaining lung homeostasis. Human and animal genetics studies confirm that abnormal HIF correlates with pulmonary vascular pathology and chronic lung diseases, but it remains unclear whether endothelial cell HIF production is essential for microvascular health. The large airway has an ideal circulatory bed for evaluating histological changes and physiology in genetically modified rodents.

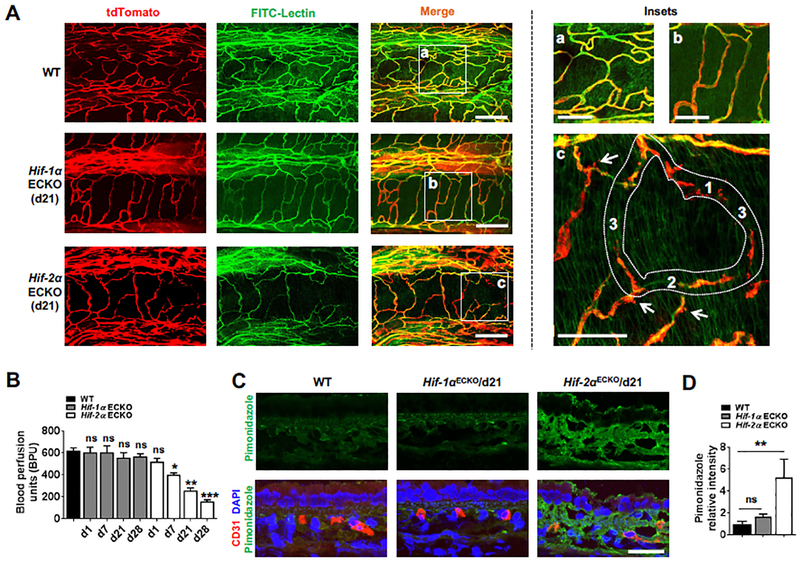
Methods: The tracheal microvasculature of mice, with conditionally deleted or overexpressed HIF-1α or HIF-2α, was evaluated for anatomy, perfusion, and permeability. Angiogenic signaling studies assessed vascular changes attributable to dysregulated HIF expression. An orthotopic tracheal transplantation model further evaluated the contribution of individual HIF isoforms in airway endothelial cells.

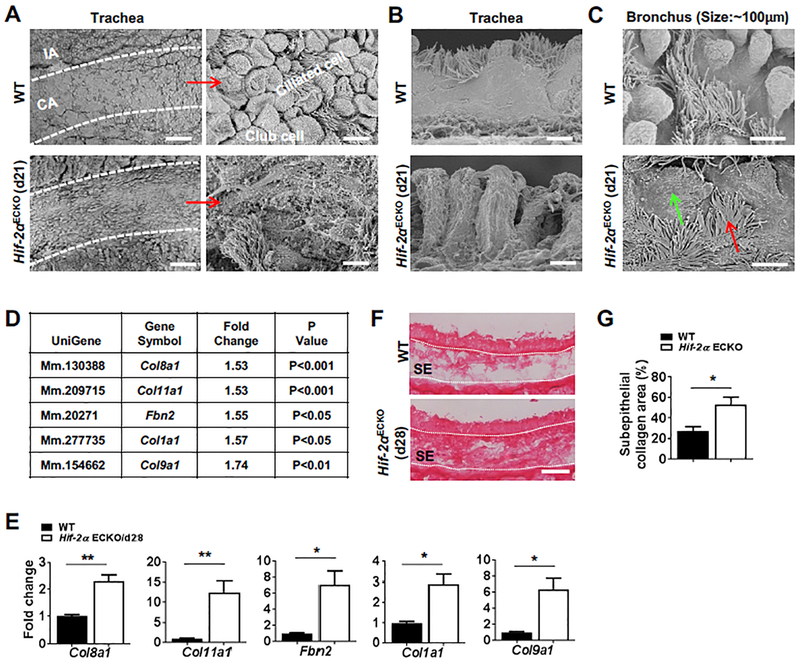
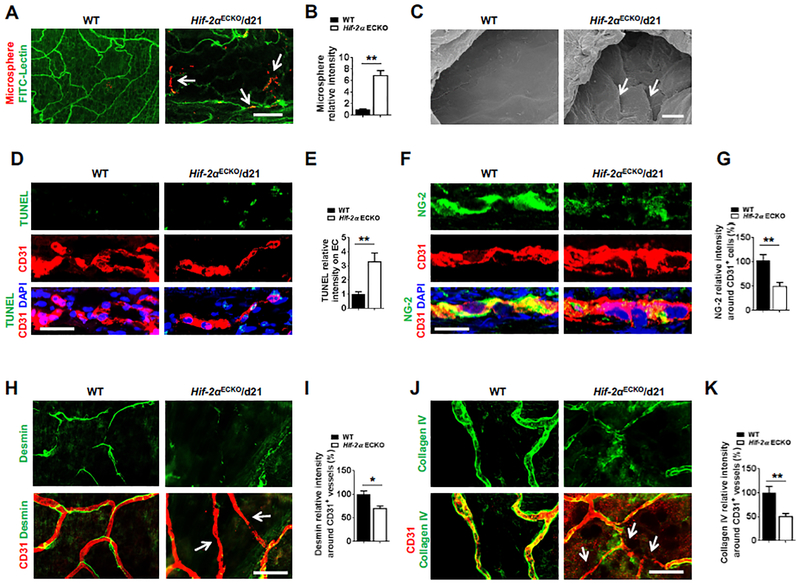
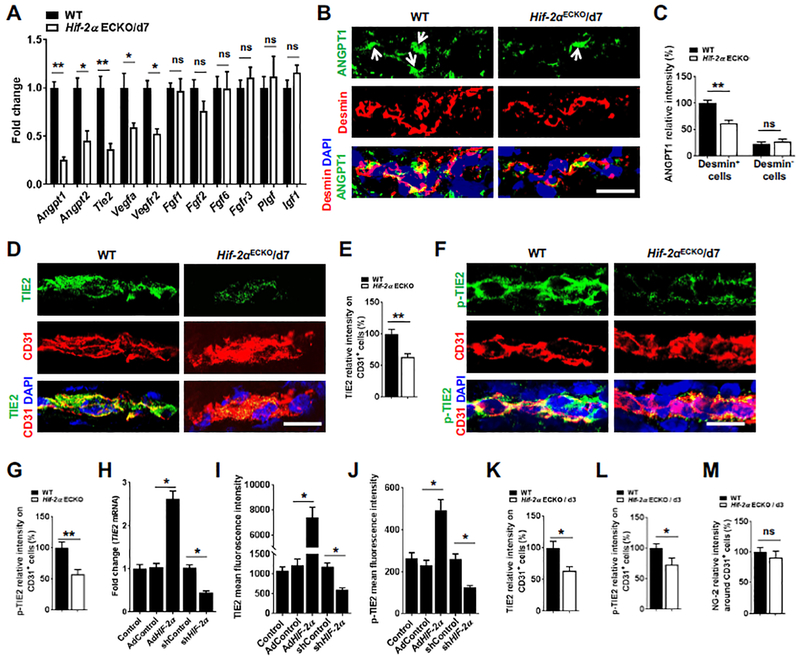
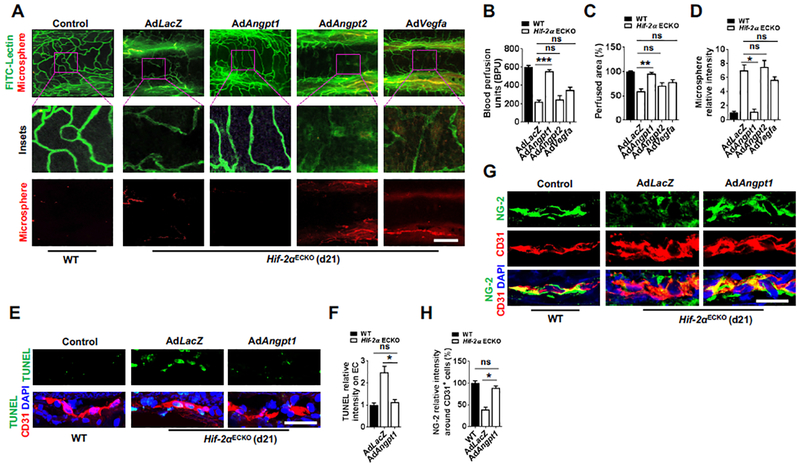
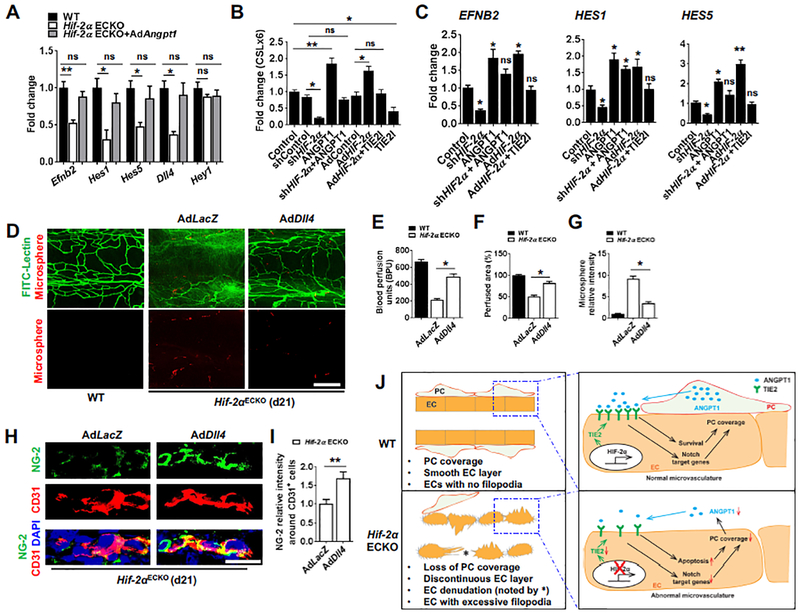
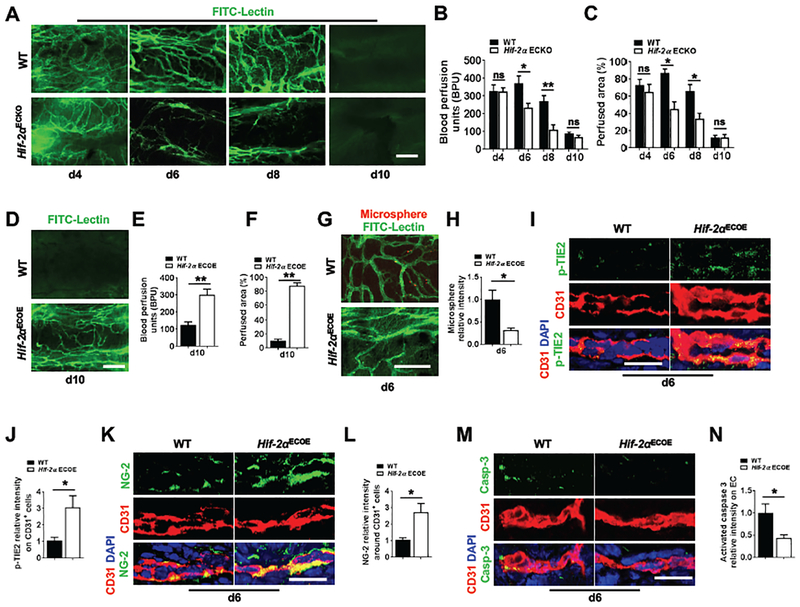
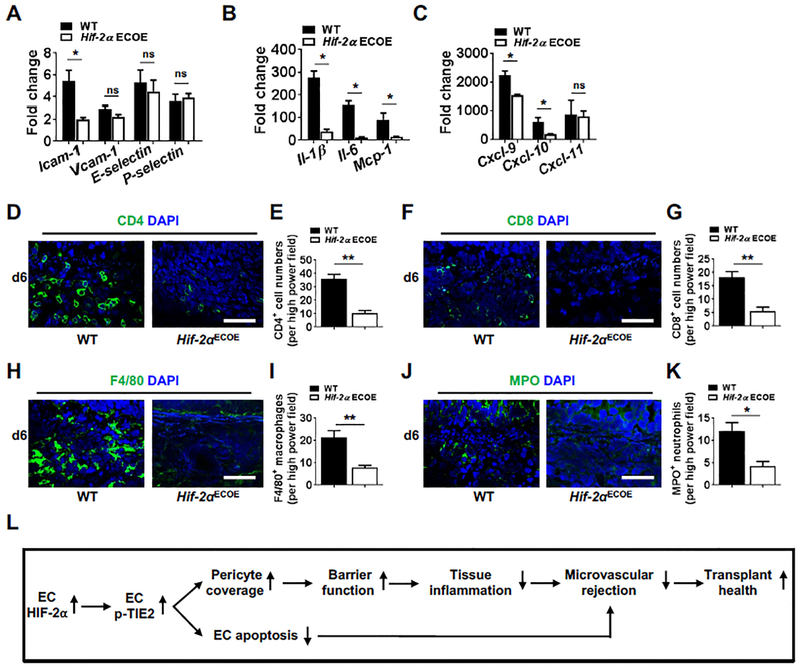
Results: The genetic deletion of Hif-2α but not Hif-1α caused tracheal endothelial cell apoptosis, diminished pericyte coverage, reduced vascular perfusion, defective barrier function, overlying epithelial abnormalities, and subepithelial fibrotic remodeling. HIF-2α promoted microvascular integrity in airways through endothelial angiopoietin-1/TIE2 signaling and Notch activity. In functional tracheal transplants, HIF-2α deficiency in airway donors accelerated graft microvascular loss, whereas HIF-2α or angiopoietin-1 overexpression prolonged transplant microvascular perfusion. Augmented endothelial HIF-2α in transplant donors promoted airway microvascular integrity and diminished alloimmune inflammation.

Conclusions: Our findings reveal that the constitutive expression of endothelial HIF-2α is required for airway microvascular health.

Keywords: HIF-2α; Notch; angiopoietin, TIE2; endothelial cells; hypoxia inducible factors; lung.


Figures

Figure 1.
Figure 1.
Endothelial-specific Hif-2α knockout causes airway microvascular perfusion attenuation, BPU decrease and tissue hypoxia. A, Representative airway microvascular FITC-lectin perfusion (green) images from WT, Hif-1αECKO or Hif-2αECKO mice (d21: 21 days following gene deletion). Blood vessel ECs are genetically marked by tdTomato fluorescence (red). a, b, c: insets of three areas marked by white dotted rectangles; white arrows in c denote ECs with excessive filopodia; c1–3 denote vessels with distinguished tdTomato (red) and perfusion (green) characteristics (n=6). B, BPU measurements for WT, Hif-1αECKO or Hif-2αECKO mice on day 1, 7, 21 and 28 after gene deletion (n=5). C, Hypoxyprobe (pimonidazole) staining. Representative immunofluorescence staining images of CD31 (red) and pimonidazole (green) of tracheas of WT, Hif-1αECKO or Hif-2αECKO mice. DAPI (blue) stains the nucleus (n=5). D, Quantification of pimonidazole intensity among the groups shown in (C) (n=5). B and D: Data are presented as mean ± SEM; ns, not significant; *P < 0.05; **P < 0.01; ***P < 0.001 compared with WT by the Kruskal-Wallis test followed by Dunn’s multiple comparisons test. All WTs are littermate controls. Scale bars: 100 μm (A), 50 μm (A, insets) and 20 μm (C).
Figure 2.
Figure 2.
Airway epithelial cell abnormality and subepithelial fibrosis following endothelial Hif-2α knockout. A, Representative SEM images of the inner surface of WT and Hif-2αECKO tracheas (n=3). CA (cartilaginous area) outlined by the white dashed lines was re-imaged using higher magnification to identify epithelial cell types. Club cells and ciliated epithelial cells were labeled. IA: Intercartilaginous area (n=3). B, Representative cross-sectional images of epithelium SEM (n=3). C, Representative SEM images of the epithelial layers of airways approximately 100 μm in diameter. Flattening of club cells (green arrow) and cilia (red arrow) was highlighted in the Hif-2αECKO samples (n=3). D, Genes upregulated in Hif-2αECKO airways were identified by microarray analysis(d28 Hif-2αECKO vs WT tracheas). Gene expression in fold change was normalized to that of the WT (n=3). E, RT-qPCR confirmation of the microarray data (n=5). F and G, Collagen deposition assessed by Picrosirius red staining of the WT or d28 Hif-2αECKO tracheas (F) and the quantification (G) (n=5). WTs are littermate controls. SE: Subepithelium. E and G: Data are presented as mean ± SEM; *P < 0.05; **P<0.01; by the Mann-Whitney test. Scale bars: 40 μm (A, left column), 20 μm (F), 8 μm (A, right column) and 4 μm (B and C).
Figure 3.
Figure 3.
Endothelial-specific Hif-2α knockout causes airway microvascular pericyte loss and augments vascular leakage. A, Representative overlay confocal images of FITC-lectin perfusion (green) and microsphere permeability analysis (red) of WT and Hif-2αECKO airways. White arrows point to microsphere leakage from blood vessels (n=5). B, Quantification of microsphere intensity comparing the groups shown in (A) (n=5). C, Representative SEM images of the WT or the Hif-2αECKO tracheas. White arrows point to EC junctions (n=3). D and F, Representative immunofluorescence staining of TUNEL (green) (D) or NG-2 (green) (F) and CD31 (red) expression in WT and Hif-2αECKO tracheas. DAPI (blue) stains the nucleus (n=6). E and G, Quantification of TUNEL (E) or NG-2 (G) intensity comparing the groups shown in (D or F) (n=6). H and J, Representative whole mount tracheal confocal images of Desmin (green) (H) or Collagen IV (green) (J) and CD31 (red) expression in WT and Hif-2αECKO airways. White arrows point to areas with no Desmin (H) or no Collagen IV (J) signal (n=6). I and K, Quantification of Desmin (I) or Collagen IV (K) expression in the groups shown in (H or J) (n=6). B, E, G, I and K: Data are presented as mean ± SEM; *P<0.05; **P < 0.01 by Mann Whitney test. Scale bars: 50 μm (A), 20 μm (D, H, J), 10 μm (F) and 4 μm (C).
Figure 4.
Figure 4.
Hif-2α ECKO diminishes airway EC TIE2 and tissue ANGPT1 expression. A, PCR-based angiogenesis array was performed on day 7 airways following ECKO of Hif-2α. Average gene expression was normalized to that of WT (n=5). B, Representative immunofluorescence staining of ANGPT1 (green) and Desmin (red) in WT and Hif-2αECKO tracheas. White arrows point to strong ANGPT1 staining in Desmin+ pericytes. DAPI (blue) stains the nucleus. C, Quantification of ANGPT1 intensity comparing the groups shown in (B) (n=6). D, Representative immunofluorescence staining of TIE2 (green) and CD31 (red) in WT and Hif-2αECKO tracheas. E, Quantification of TIE2 intensity in groups shown in (D) (n=5). F, Representative immunofluorescence staining of p-TIE2 (green) and CD31 (red) in WT and Hif-2αECKO tracheas. G, Quantification of p-TIE2 intensity comparing the groups shown in (F) (n=6). H, PCR analysis of TIE2 expression. PAECs treated with or without AdHIF-2α or shHIF-2α for 72 hours were subjected to RT-qPCR analysis. Empty viral vectors (AdControl or shControl) were used as controls (n=6). I and J, Quantification of TIE2 (I) and p-TIE2 (J) mean fluorescence intensity of the flow cytometry data presented in Supplemental Figure 7B. K, L and M, Quantification of EC TIE2 and p-TIE2, and NG-2 expression in WT and Hif-2αECKO tracheas 3 days following gene deletion (staining data presented in Supplemental Figure 8) (n=6). A, C, E, G-M: Data are presented as mean ± SEM; ns, not significant; *P<0.05; **P < 0.01 by Mann Whitney test comparing WT and Hif-2αECKO groups (A, C, E, G and K-M), or by the Kruskal-Wallis test followed by Dunn’s multiple comparisons test (H-J). Scale bars: 40 μm (B) and 10 μm (D, F).
Figure 5.
Figure 5.
AdAngpt1, but not AdAngpt2 or AdVegfa gene therapy prevents airway microvascular attenuation in Hif-2αECKO mice. A, Representative views of FITC-lectin perfusion (green) and microsphere leakage(red) study of WT and Hif-2αECKO mice with or without AdAngpt1, AdAngpt2 or AdVegfa treatment. Adenoviral particles were injected intravenously on the first day of tamoxifen administration. Samples were harvested on day 21 following Hif-2α deletion. LacZ adenovirus was used as the adenoviral vector control (n=5). B, BPU measurement in WT and Hif-2αECKO mice with or without AdAngpt1, AdAngpt2 or AdVegfa treatment (n=8). C and D, Quantification of the perfused area (C) and microsphere leakage (D) comparing the groups in (A) (n=5). E and G, Representative immunofluorescence staining of TUNEL (green) (E) or NG-2 (green) (G) and CD31 (red) of WT and Hif-2αECKO tracheas treated with AdLacZ or AdAngpt1. F and H, Quantification of TUNEL (F) (n=6) or NG-2 (H) (n=5) intensity comparing the groups shown in (E or G). B-D, F and H: Data are presented as mean ± SEM; ns, not significant; *P < 0.05; **P < 0.01; ***P < 0.001 by the Kruskal-Wallis test followed by Dunn’s multiple comparisons test. Scale bars: 100 μm (A), 20 μm (G) and 10 μm (E).
Figure 6.
Figure 6.
ANGPT1 restores diminished Notch activity in Hif-2αECKO airways and in Hif-2α deficient PAECs. A, PCR analysis of representative Notch target genes expressed in WT and Hif-2αECKO airways with or without AdAngpt1 (WT: n=5; Hif-2αECKO: n=6; Hif-2αECKO+AdAngpt1, n=4). B, Luciferase activity of PAECs co-transfected with Notch reporter plasmid pG13–11-CSL and pRL-SV40. PAECs were treated with shHIF-2α, AdHIF-2α, recombinant ANGPT1 (50ng/ml), shHIF-2α+ANGPT1, TIE2I (TIE2 inhibitor, 2.5μM) and AdHIF-2α+TIE2I for 72 hours followed by the reporter assay; shControl, AdControl are vector controls (n=5). C, RT-qPCR analysis of Notch target genes EFNB2, HES1 and HES5 in PAEC culture treated with shHIF-2α, AdHIF-2α, AdHIF-2α+TIE2I, ANGPT1 (50 ng/ml) or shHIF-2α+ANGPT1 for 72 hours (n=5). D, Representative images of FITC-lectin perfusion (green) and microsphere leakage (red) study of WT and Hif-2αECKO mice with or without AdDll4 treatment. Adenoviral particles were locally administered to the trachea on the first day of tamoxifen administration. Samples were harvested at day 21 following Hif-2α deletion. LacZ adenovirus was used as the adenoviral vector control (n=8). E, BPU measurement of the WT and Hif-2αECKO airways with or without AdDll4 treatment (n=7). F and G, Quantification of perfused area (F) (n=8) and microsphere leakage (G) (n=8) comparing the groups in (D). H, Representative immunofluorescence staining of NG-2 (green) and CD31 (red) in Hif-2αECKO tracheas treated with AdLacZ or AdDll4. I, Quantification of NG-2 intensity comparing the groups shown in (H) (n=6). J, HIF-2α maintains airway microvascular integrity. Normal airway microvasculature displays a quiescent EC layer and intact pericyte coverage. HIF-2α maintains the normal vasculature by sustaining ANGPT1/TIE2 signaling. Pericyte-derived ANGPT1 activates HIF-2α-regulated TIE2, which promotes cell survival and activates the Notch target genes and preserves pericyte coverage and vessel integrity. EC HIF-2α deficiency leads to loss of pericyte coverage and EC death or appearance of excessive filopodia protrusions. Diminished TIE2 expression caused by HIF-2α deficiency leads to decreased ANGPT1/TIE2 signaling, which through increasing cell apoptosis or reducing Notch signaling, causes pericyte loss. Decreased pericyte numbers lead to lower ANGPT1 production and further reduce ANGPT1/TIE2 signaling. A-C, E-G and I: Data are presented as mean ± SEM; ns, not significant; *P < 0.05; **P < 0.01; by the Kruskal-Wallis test followed by Dunn’s multiple comparisons test (A, E-G), by the Mann-Whitney test (I), or by one-way ANOVA followed by Tukey’s multicomparisons test (B and C) (C: significance compared to control). PC: pericytes. Scale bars: 100 μm (D) and 20 μm (H).
Figure 7.
Figure 7.
HIF-2α enhances EC TIE2 activity and improves microvascular perfusion and integrity in airway transplants. A, Representative images of microvascular FITC-lectin perfusion (green) analysis (from day 4 to 10) of transplants using either WT or Hif-2αECKO airways as donors (n=6). B and C, BPU measurements (B) (n=6) and perfused area assessment (C) (n=5) of the WT or Hif-2αECKO airway transplants. D, Representative images of microvascular FITC-lectin perfusion (green) analysis of day 10 transplants using either WT or Hif-2αECOE airways as donors (n=5). E and F, BPU measurements (E) and perfused area assessment (F) of the WT or Hif-2αECOE airway transplants (n=5). G, Representative overlay confocal images of FITC-lectin perfusion (green) and microsphere permeability(red) analysis of the day 6 transplants using either WT or Hif-2αECOE airways as donors (n=5). H, Quantification of microsphere intensity comparing the groups in (G) (n=5). I and J, Representative immunofluorescence staining of p-TIE2 (green) and CD31 (red) in day 6 transplants using either WT or Hif-2αECOE airways as donors (I) and quantification of the p-TIE2 intensity (J) (n=6). K and L, Representative immunofluorescence staining of NG-2 (green) and CD31 (red) of the day 6 transplants using either WT or Hif-2αECOE airways as donors (K) and quantification of the NG-2 intensity (L) (n=6). M and N, Representative immunofluorescence staining of activated Caspase 3 (green) and CD31 (red) of the day 6 transplant using either WT or Hif-2αECOE airways as donors (M) and quantification of the activated Caspase 3 intensity (N) (n=6). B, C, E, F, H, J, L, and N: Data are presented as mean ± SEM; ns, not significant; *P < 0.05; **P < 0.01; by the Mann-Whitney test. Scale bars: 100 μm (A, D, and G) and 20 μm (I, K and M).
Figure 8.
Figure 8.
Endothelial Hif-2α overexpression in the donor suppresses alloimmune response and tissue inflammation. A-C, RT-qPCR analysis of the mRNA expression of endothelial adhesion molecules (A) (n=4), inflammatory cytokines (B) (n=4) or rejection associated chemokines (C) (n=3–4) in the d6 WT or Hif-2αECOE airway transplants. D, F, H and J, Representative immunofluorescence staining images of CD4 (green) (D), CD8 (green) (F), F4/80 (green) (H) and MPO (green) (J) in day 6 WT or Hif-2αECOE airway transplants. DAPI (blue) stains the nucleus. E, G, I and K, Quantification of the immune cell staining presented in panels D, F, H, and J, respectively (n=5). L, A schematic illustrating HIF-2α maintains vascular integrity in pathophysiology. In airway transplant undergoing acute rejection, increased HIF-2α expression augments TIE2 activity (corresponding to increased p-TIE2 levels), which reduces EC apoptosis and increases microvascular barrier function through augmenting vascular pericyte coverage. These effects together diminish transplant microvascular rejection and improve transplant health. A, B, C, E, G, I and K: Data are presented as mean ± SEM; ns, not significant; *P < 0.05; **P < 0.01; by the Mann-Whitney test. Scale bars: 20 μm (D, F, H and J).

Similar articles

Cited by

References

    1. Jiang X, Sung YK, Tian W, Qian J, Semenza GL and Nicolls MR. Graft microvascular disease in solid organ transplantation. J Mol Med (Berl). 2014;92:797–810. - PMC - PubMed
    1. Farkas L and Kolb M. Pulmonary microcirculation in interstitial lung disease. Proc Am Thorac Soc. 2011;8:516–521. - PubMed
    1. Dorfmuller P, Gunther S, Ghigna MR, Thomas de Montpreville V, Boulate D, Paul JF, Jais X, Decante B, Simonneau G, Dartevelle P, Humbert M, Fadel E and Mercier O. Microvascular disease in chronic thromboembolic pulmonary hypertension: a role for pulmonary veins and systemic vasculature. Eur Respir J. 2014;44:1275–1288. - PubMed
    1. Majmundar AJ, Wong WJ and Simon MC. Hypoxia-inducible factors and the response to hypoxic stress. Mol Cell. 2010;40:294–309. - PMC - PubMed
    1. Yu AY, Shimoda LA, Iyer NV, Huso DL, Sun X, McWilliams R, Beaty T, Sham JS, Wiener CM, Sylvester JT and Semenza GL. Impaired physiological responses to chronic hypoxia in mice partially deficient for hypoxia-inducible factor 1alpha. J Clin Invest. 1999;103:691–696. - PMC - PubMed

Publication types

MeSH terms

Substances