. 2019 Jan 29;139(5):679-693.
doi: 10.1161/CIRCULATIONAHA.118.034615.

LMO7 Is a Negative Feedback Regulator of Transforming Growth Factor β Signaling and Fibrosis

Affiliations

LMO7 Is a Negative Feedback Regulator of Transforming Growth Factor β Signaling and Fibrosis

Yi Xie et al. Circulation. .

Abstract

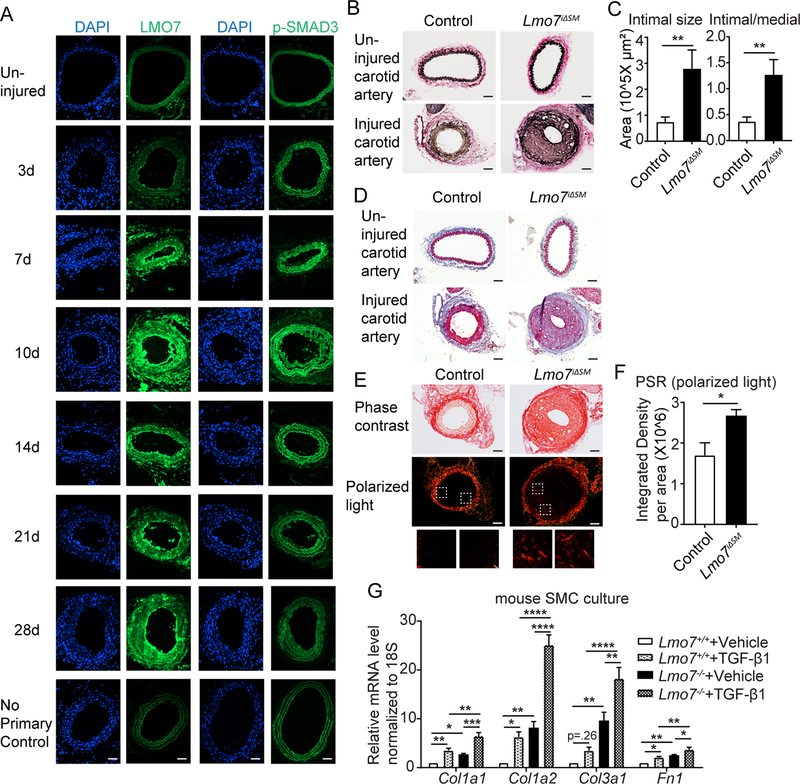
Background: Vascular smooth muscle cells (SMCs) synthesize extracellular matrix (ECM) that contributes to tissue remodeling after revascularization interventions. The cytokine transforming growth factor β (TGF-β) is induced on tissue injury and regulates tissue remodeling and wound healing, but dysregulated signaling results in excess ECM deposition and fibrosis. The LIM (Lin11, Isl-1 & Mec-3) domain protein LIM domain only 7 (LMO7) is a TGF-β1 target gene in hepatoma cells, but its role in vascular physiology and fibrosis is unknown.

Methods: We use carotid ligation and femoral artery denudation models in mice with global or inducible smooth muscle-specific deletion of LMO7, and knockout, knockdown, overexpression, and mutagenesis approaches in mouse and human SMC, and human arteriovenous fistula and cardiac allograft vasculopathy samples to assess the role of LMO7 in neointima and fibrosis.

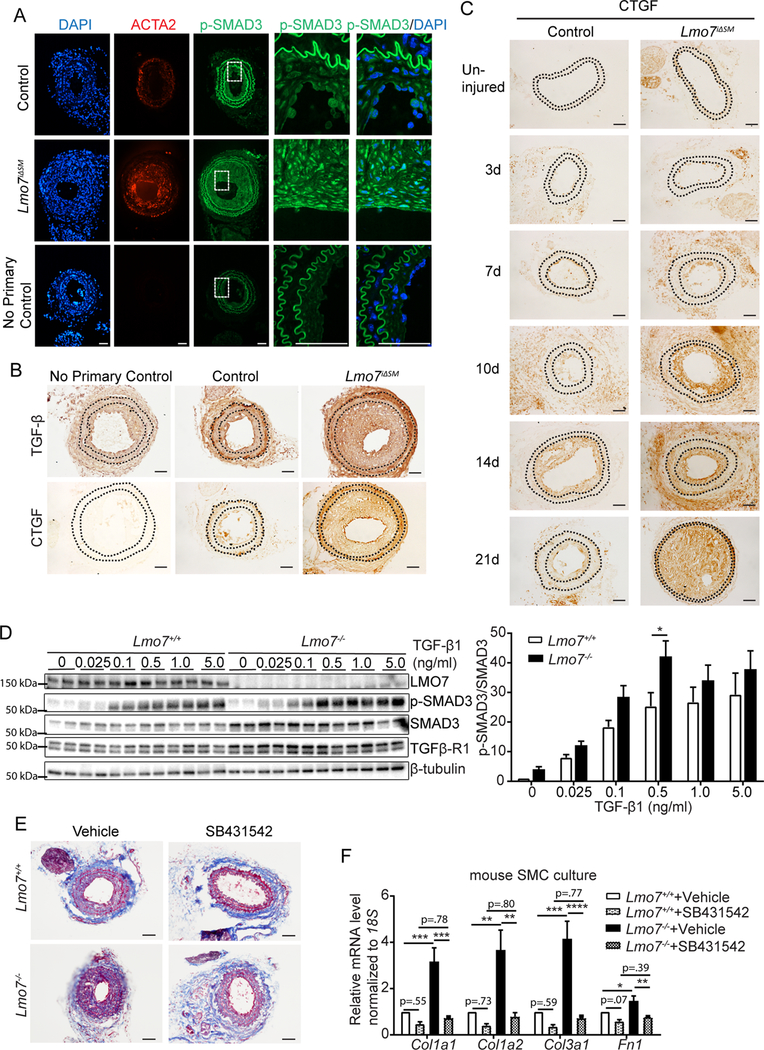
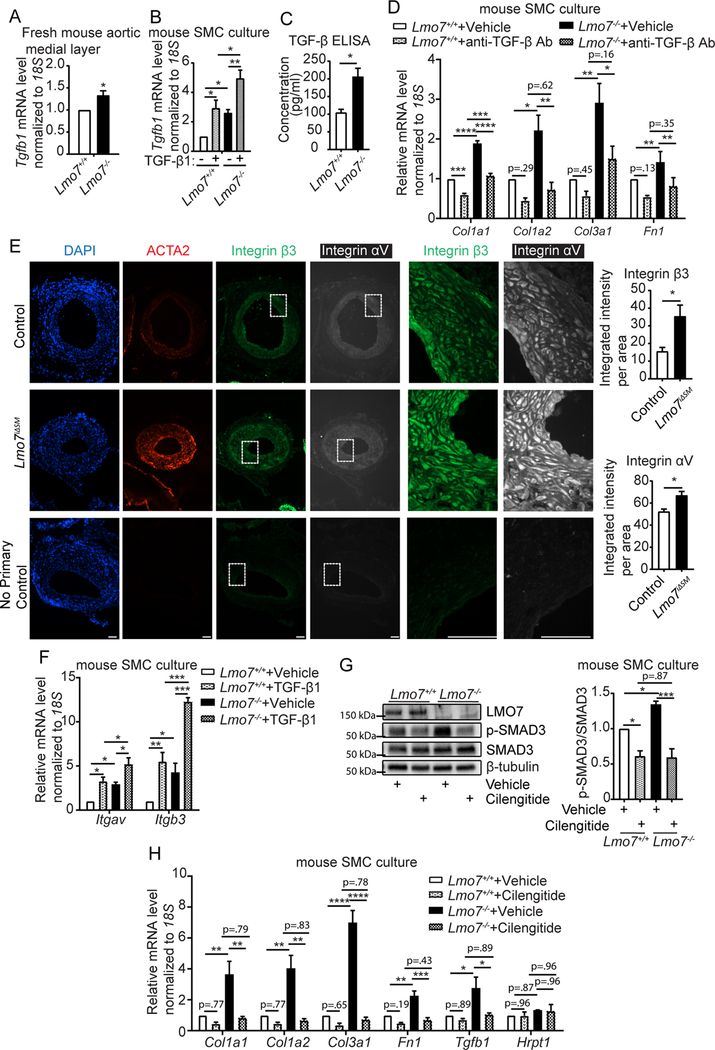
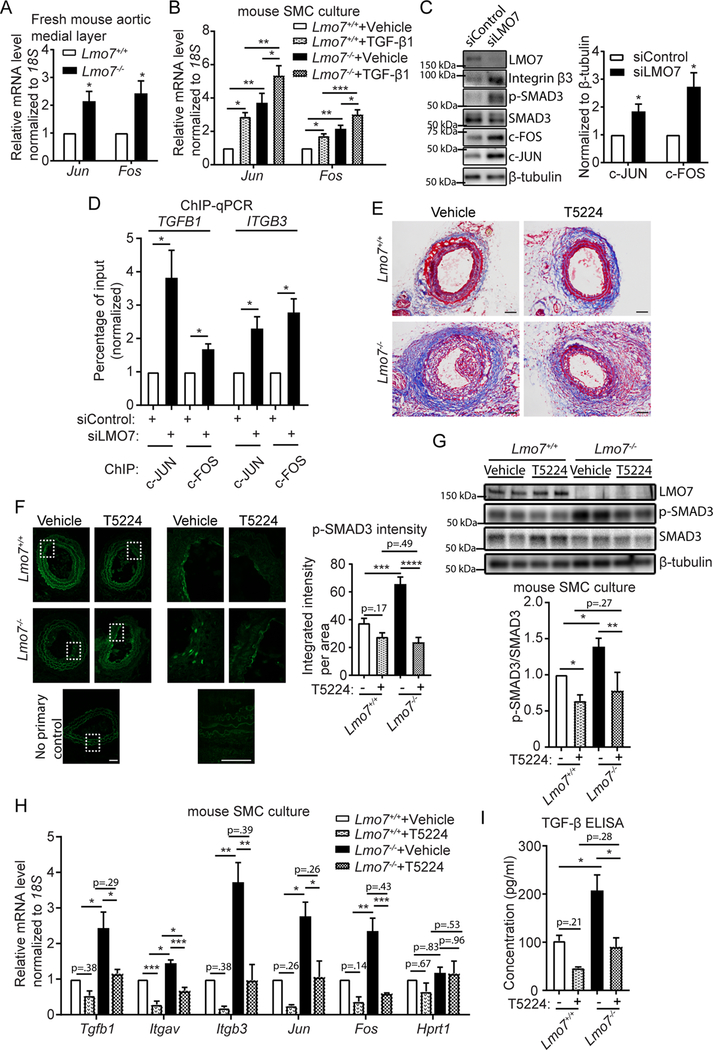
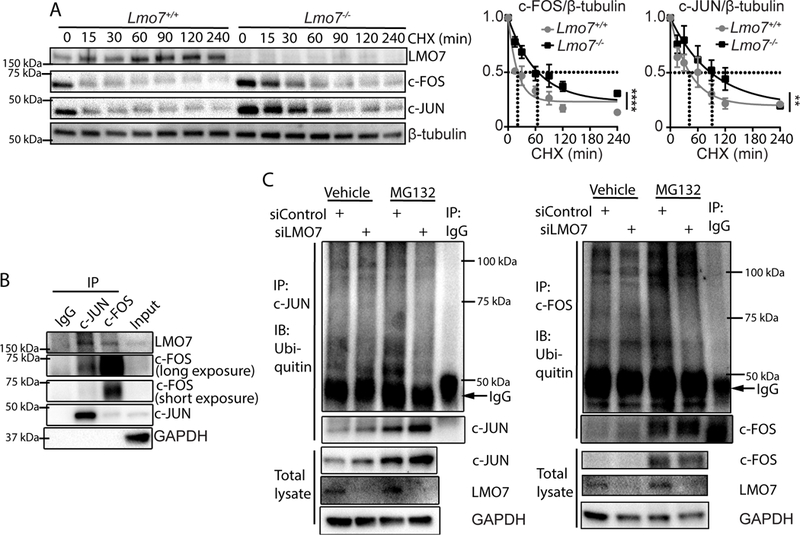
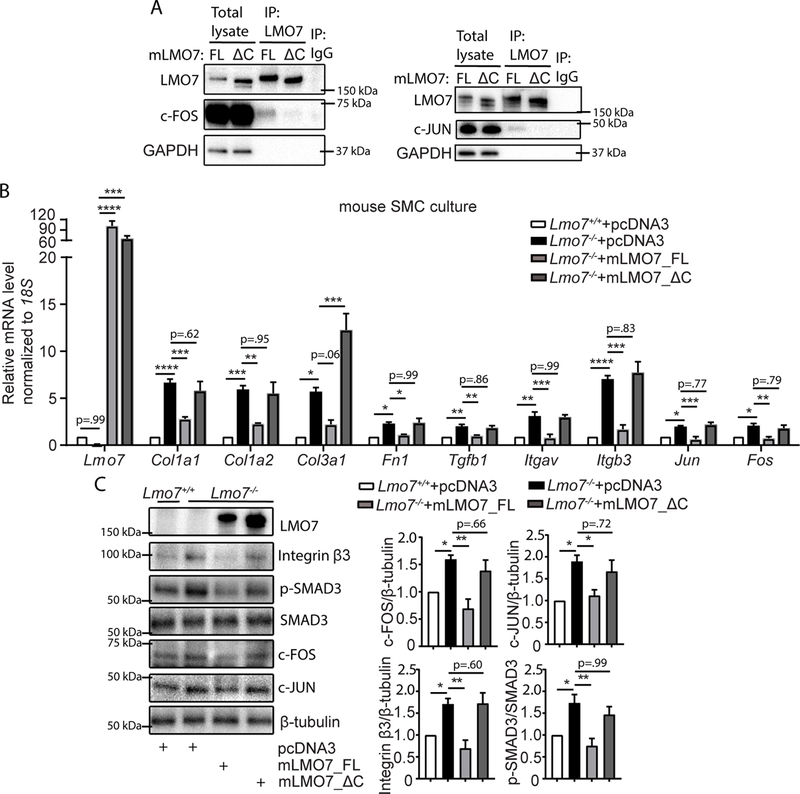
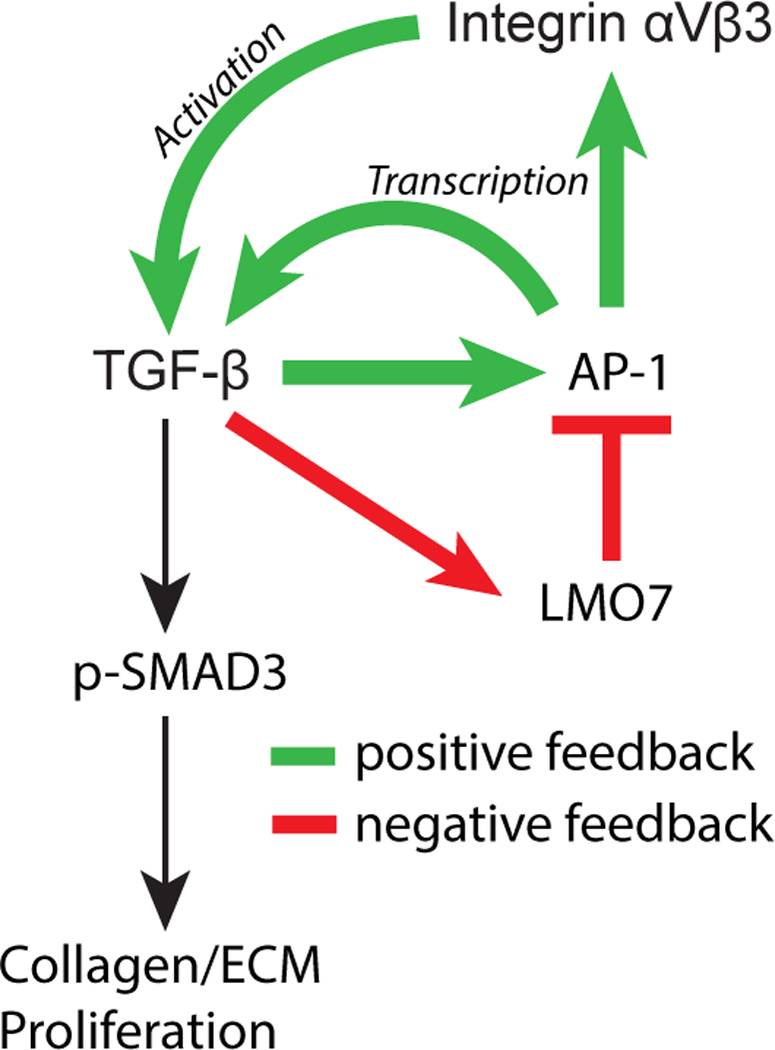
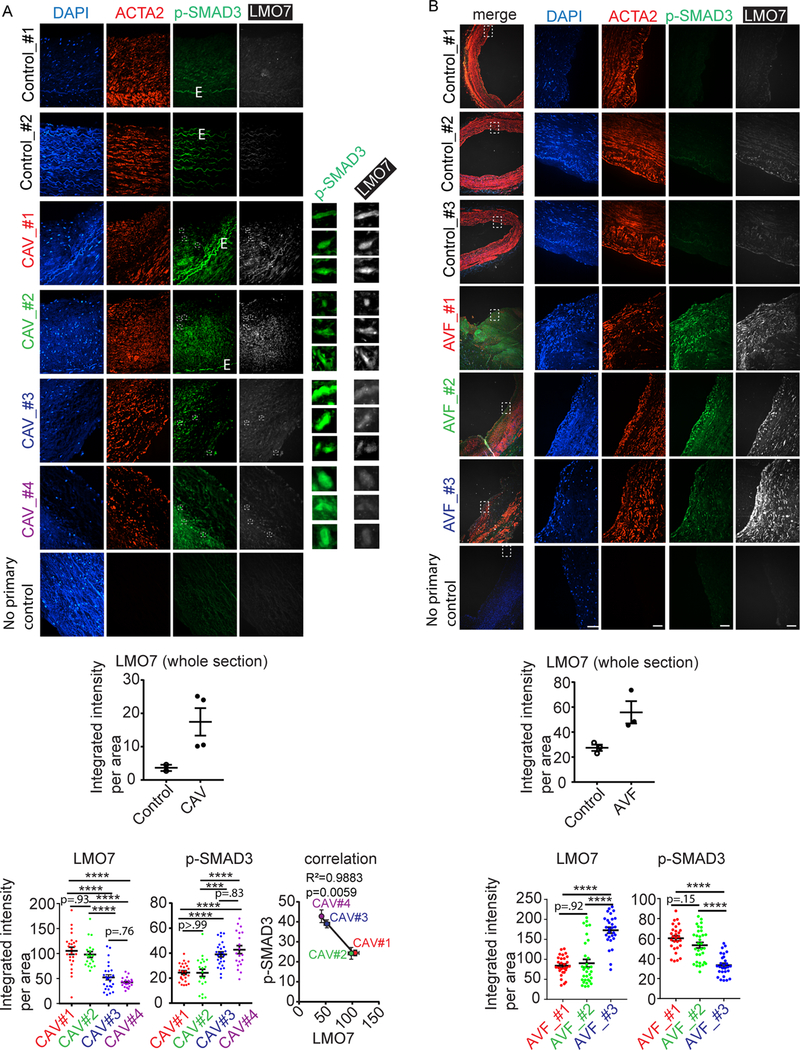
Results: We demonstrate that LMO7 is induced postinjury and by TGF-β in SMC in vitro. Global or SMC-specific LMO7 deletion enhanced neointimal formation, TGF-β signaling, ECM deposition, and proliferation in vascular injury models. LMO7 loss of function in human and mouse SMC enhanced ECM protein expression at baseline and after TGF-β treatment. TGF-β neutralization or receptor antagonism prevented the exacerbated neointimal formation and ECM synthesis conferred by loss of LMO7. Notably, loss of LMO7 coordinately amplified TGF-β signaling by inducing expression of Tgfb1 mRNA, TGF-β protein, αv and β3 integrins that promote activation of latent TGF-β, and downstream effectors SMAD3 phosphorylation and connective tissue growth factor. Mechanistically, the LMO7 LIM domain interacts with activator protein 1 transcription factor subunits c-FOS and c-JUN and promotes their ubiquitination and degradation, disrupting activator protein 1-dependent TGF-β autoinduction. Importantly, preliminary studies suggest that LMO7 is upregulated in human intimal hyperplastic arteriovenous fistula and cardiac allograft vasculopathy samples, and inversely correlates with SMAD3 phosphorylation in cardiac allograft vasculopathy.

Conclusions: LMO7 is induced by TGF-β and serves to limit vascular fibrotic responses through negative feedback regulation of the TGF-β pathway. This mechanism has important implications for intimal hyperplasia, wound healing, and fibrotic diseases.

Keywords: extracellular matrix; fibrosis; smooth muscle; transcription factors; transforming growth factor.


Figures

Figure 1
Figure 1. Loss of LMO7 in SMC exacerbates intimal hyperplasia and ECM deposition.
(A) WT mice were subjected to carotid artery ligation and injured vessels were harvested at time points ranging from 3 to 28 days. Cryosections were immunostained for LMO7 (green) (left panel). Adjacent sections were immunostained for p-SMAD3 (green) (right panel). DAPI was used to visualize nuclei. Representative images from two mice at each time point are shown. 20 sections were stained for LMO7 or pSMAD3 per individual per time point. (B) EVG staining of tissue sections from control or Lmo7iΔSM mice 28 days after carotid artery ligation. (C) Quantification of intimal size and intimal/medial ratio of injured carotid arteries (n=10). (D) Trichrome staining of cross-sections of contralateral uninjured and injured arteries of control or Lmo7iΔSM mice after carotid ligation. (E) Picro-Sirius Red staining of cross-sections of injured arteries of control or Lmo7iΔSM mice at 28 days post carotid ligation by phase contrast (upper panel) or polarized light (lower panel) microscopy. (F) Quantification of relative integrated intensity of the signal in medial and intimal layers shown in polarized light images in (E) (n=5). (G) Mouse aortic SMCs were treated with 0.5ng/ml TGF-β1 for 24hrs and mRNA was harvested for qPCR analysis of ECM genes (n=4 independent experiments). Two-way ANOVA revealed a significant effect of LMO7 depletion and TGF-β1 treatment on mRNA expression. For Col1a2 mRNA only, LMO7 depletion significantly enhanced the TGF-β1 effect on expression (p=0.0009). Scale bar=50 μm. Data are expressed as mean ± S.E.M. *P < 0.05, **P < 0.01, ***P < 0.001, ****P < 0.0001
Figure 2
Figure 2. TGF-β signaling and ECM gene expression are augmented in LMO7 deficient SMCs.
(A, B) Immunostaining of (A) p-SMAD3 (green) or ACTA2 (red) or (B) TGF- β or CTGF in tissue sections from control and Lmo7iΔSM mice after carotid artery ligation. (C) CTGF Immunohistochemistry of arterial sections of control and Lmo7iΔSM mice after carotid artery ligation for durations as indicated. (D) Western analysis of Lmo7+/+ or Lmo7−/− mouse SMCs treated with TGF-β1 at indicated doses for 24 hrs. Quantification of SMAD3 phosphorylation is shown on right (n=6 independent experiments). Two-way ANOVA revealed a significant effect of LMO7 depletion and TGF-β1 dose effect on p-SMAD3 phosphorylation, but there was no significant interaction between Lmo7−/− and TGF-β1 treatment. (E) Lmo7+/+ or Lmo7−/− mice were subjected to carotid ligation and injected intraperitoneally with SB4341542 (10mg/kg/d) or Vehicle (1% DMSO/30% polyethylene/ 1% Tween 80) daily from days 7–28 post-ligation. Trichrome staining of cross-sections of injured arteries is shown. (F) qPCR analysis of ECM genes in Lmo7+/+ or Lmo7−/− mouse SMCs treated with 10 μM SB431542 or Vehicle for 24 hrs (n=5 independent experiments). Two-way ANOVA revealed a significant effect of LMO7 depletion and TGF-β receptor inhibition on mRNA expression. For Col1a1, Col1a2 and Col3a1 mRNA, the magnitude of reduction was greater in Lmo7−/− SMCs (Col1a1 p=0.0057, Col1a2 p=0.019, Col3a1 p=0.0022), indicating LMO7 regulates many ECM genes via TGF-β signaling. Scale bar=50 μm. Data are expressed as mean ± S.E.M. *P < 0.05, **P < 0.01, ***P < 0.001, ****P < 0.0001
Figure 3
Figure 3. Loss of LMO7 induced elevated expression of TGF-β1 and αvβ3 integrin, a latent TGF-β1 activator.
(A) qPCR analysis of Tgfb1 gene expression in medial layers of freshly isolated mouse aortas (n=4 independent experiments). (B) Mouse SMCs were treated with 0.5 ng/ml TGF-β1 for 24hrs and mRNA was harvested for qPCR analysis of Tgfb1 gene (n=4 independent experiments). Two-way ANOVA revealed a significant effect of LMO7 depletion and TGF-β1 treatment on Tgfb1 mRNA expression but there was no significant interaction between Lmo7−/− and TGF-β1 treatment. (C) Lmo7+/+ or Lmo7−/− mouse SMCs with the same confluency were cultured in 0.5% FBS for 24 hrs. Conditioned media was harvested to quantitate total TGF-β secretion by ELISA. (n=4 independent experiments). (D) qPCR analysis of ECM genes from Lmo7+/+ or Lmo7−/− mouse SMCs treated with 40 μg/ml TGF-β neutralizing antibody (Clone #1D11) or Vehicle for 24 hrs (n=3 independent experiments). Two-way ANOVA revealed a significant effect of LMO7 depletion and anti-TGF-β neutralizing antibody treatment on mRNA expression. LMO7 depletion resulted in a greater magnitude of reduction by neutralizing antibody treatment for Col1a1 mRNA (p=0.0022). (E) Immunostaining of ACTA2 (red), β3 Integrin (green) and αv Integrin (white) on tissue sections from control and Lmo7iΔSM mice 21 days after femoral artery injury. Scale bar=50 μm. Cells from each mouse were randomly picked and β3 and αv Integrin staining intensity was measured and normalized to cell area. Quantification is shown on right (n=4). (F) Mouse SMCs were treated with 0.5ng/ml TGF-β1 for 24hrs and mRNA was harvested for qPCR analysis of Itgav and Itgb3 genes (n=3 independent experiments). Two-way ANOVA revealed a significant effect of LMO7 depletion and TGF-β1 treatment on mRNA expression, but there was no significant interaction between Lmo7−/− and TGF-β1 treatment. (G, H) Mouse SMCs were treated with 20 μM Cilengitide or Vehicle for 24hrs and cell lysates were harvested for (G) western analysis of SMAD3 phosphorylation (n=3 independent experiments) or (H) qPCR analysis of ECM and Tgfb1 genes (n=3 independent experiments). Hprt1 was used as a negative control in qPCR analysis. Two-way ANOVA revealed a significant effect of LMO7 depletion and Cilengitide treatment on SMAD3 phosphorylation and mRNA expression, and the magnitude of reduction was greater with Cilengitide treatment in Lmo7−/− SMCs for all the readouts except Tgfb1 mRNA (SMAD3 phosphorylation p=0.013, Col1a1 p=0.030, Col1a2 p=0.0098, Col3a1 p=0.0001, Fn1 p=0.015), indicating LMO7 regulates TGF-β activity as well as Tgfb1 and ECM gene expression by modulating αvβ3 Integrin activity. Data are expressed as mean ± S.E.M. *P < 0.05, **P < 0.01, ***P < 0.001, ****P < 0.0001
Figure 4
Figure 4. LMO7 inhibits AP-1 activity and TGF-β1 autoinduction.
(A) qPCR analysis of Jun and Fos genes in medial layers of freshly isolated mouse aortas (n=4 independent experiments). (B) Mouse SMCs were treated with 0.5ng/ml TGF-β1 for 24hrs and mRNA was harvested for qPCR analysis of Jun and Fos genes (n=5 independent experiments). Two-way ANOVA revealed a significant effect of LMO7 depletion and TGF-β1 treatment on mRNA expression but there was no significant interaction between Lmo7−/− and TGF-β1 treatment. (C) Western analysis of human CASMCs transfected with control or LMO7 siRNA for 72 hrs. Quantification of c-JUN and c-FOS is shown on right (n=4 independent experiments). (D) Chromatin immunoprecipitation (ChIP) with c-JUN or c-FOS antibodies from human CASMCs transfected with control or LMO7 siRNA for 72 hrs, followed by qPCR analysis using primers flanking the AP-1 binding sites in TGFB1 or ITGB3 promoters (n=4 independent experiments). (E, F) Lmo7+/+ or Lmo7−/− mice were subjected to carotid ligation and injected intratracheally with T5224 (30mg/kg/d) or Vehicle (polyvinylpyrrolidone solution) daily from day 4 post-ligation. Mice were sacrificed at day 14 and carotid arteries were harvested. Trichrome (E) or p-SMAD3 (F) staining of cross-sections of injured arteries is shown. p-SMAD3 staining intensity per cell area were measured and shown on right (n=4). Two-way ANOVA revealed a significant effect of LMO7 depletion and T5224 treatment on p-SMAD3 staining intensity and the magnitude of reduction by T5224 treatment was greater in Lmo7−/− mice (p=0.0013), indicating LMO7 regulates TGF-β activity by modulating AP-1 activity. (G, H) Mouse SMCs were treated with 40 μM T5224 for 24hrs and cell lysates were harvested for (G) western analysis of SMAD3 phosphorylation (n=3 independent experiments) or (H) qPCR analysis of Tgfb1, Itgav, Itgb3, Jun and Fos genes (n=3 independent experiments) Hprt1 was used as a negative control in qPCR analysis. Two-way ANOVA revealed a significant effect of LMO7 depletion and T5224 treatment on p-SMAD3 phosphorylation and mRNA expression and the magnitude of reduction by T5224 treatment was greater in Lmo7−/− SMCs for Itgb3 (p=0.026) and Fos (p=0.019) mRNA only. (I) Lmo7+/+ or Lmo7−/− mouse SMCs with the same confluency were treated with 40 μM T5224 or Vehicle for 24 hrs. Conditioned media was harvested to quantitate total TGF-β secretion by ELISA (n=3 independent experiments). Two-way ANOVA revealed a significant effect of LMO7 depletion and T5224 treatment on TGF-β1 production, but there was no significant interaction between Lmo7−/− and T5224 treatment. Data are expressed as mean ± S.E.M. *P < 0.05, **P < 0.01, ***P < 0.001
Figure 5
Figure 5. LMO7 suppresses c-FOS and c-JUN levels by promoting their ubiquitination and proteasomal degradation.
(A) Lmo7+/+ or Lmo7−/− mouse SMCs were treated with 200 μg/ml Cycloheximide and harvested at various time points as indicated for western analysis. Quantification of c-JUN or c-FOS is shown on right (n=3 independent experiments). Stars indicate that the curves are significantly different. (B) Western analysis of immunoprecipitates using antibodies against c-JUN or c-FOS from human CASMCs. (C) Human CASMCs were transfected with control or LMO7 siRNA for 72 hrs and treated with 10 μM MG132 (proteasome inhibitor) or Vehicle for another 6 hrs as indicated. Cell lysates were then immunoprecipitated with antibodies against c-JUN (left panel) or c-FOS (right panel), followed by immunoblotting for ubiquitin. The dark bands just below 50 kDa in the ubiquitin blots are heavy chain of the antibodies used to immunoprecipitate c-JUN or c-FOS. Poly-ubiquitinated bands of modified c-JUN or c-FOS can be noted along the entire length of the blot and are intensified upon inhibition of proteasomal degradation. These bands are absent in the negative control IgG IPs. Immunoblots of these same IP samples blotted for c-JUN or c-FOS are shown immediately below the ubiquitin blots and reveal enhanced total levels of these proteins when degradation is blocked. Controls westerns showing total protein levels are shown at the bottom of the figure.
Figure 6
Figure 6. The LMO7 LIM domain is required for interaction with c-FOS and c-JUN and regulation of ECM and TGF-β pathway genes.
(A) HEK293A cells were transfected with pcDNA3-mLmo7-FL or ΔC and c-FOS (left panel) or c-JUN (right panel) plasmids. After 24 hrs, cell lysates were harvested for immunoprecipitation with LMO7 antibody and western analysis. The image shown is representative of two independent experiments. (B, C) (B) qPCR (n=4 independent experiments) or (C) Western analysis of Lmo7+/+ or Lmo7−/− mouse SMCs transfected with pcDNA3 vector, pcDNA3-mLmo7-FL or ΔC for 24 hrs as indicated. Quantification of c-FOS, c-JUN and β3 integrin expression and SMAD3 phosphorylation in western is shown on right (n=3 independent experiments). One-way ANOVA and multiple comparison with Sidak correction analysis revealed significant differences between conditions as indicated by asterisks in panels (B-C). Data are expressed as mean ± S.E.M. *P < 0.05, **P < 0.01, ***P < 0.001, ****P < 0.0001.
Figure 7
Figure 7. Model of LMO7 feedback regulation of TGF-β.
TGF-β signaling autoamplifies through AP-1-dependent transcriptional induction of TGFB1 and its activators, αv (ITGAV) and β3 (ITGB3) integrins. At high doses and later time points, TGF-β signaling induces expression of LMO7, which binds to and promotes the ubiquitination and degradation of AP-1 transcription factors, c-FOS and c-JUN. The resulting reduction in TGF-β activity decreases canonical SMAD3 signaling to ECM target genes including collagen, as well as cell proliferation. Positive feedback processes are indicated by green arrows, negative feedback is indicated by red arrows and lines.
Figure 8
Figure 8. LMO7 expression is inversely correlated with pSMAD3 in human intimal hyperplasia in CAV and patent AVF.
(A, B) Immunofluorescence of p-SMAD3 (green), ACTA2 (red) and LMO7 (white) and DAPI nuclear staining in tissue sections of biopsies from patients with (A) cardiac allograft vasculopathy (CAV, n=4) or normal control coronary arteries (n=2) or (B) patent normally remodeling vein from arteriovenous fistula (AVF, n=3) or normal control veins (n=3). Preliminary analysis of a small number of samples suggests that LMO7 expression level was elevated in the diseased arteries or veins. Quantification of staining in entire section is shown in the upper graph in each panel. White boxes in the CAV images indicate areas shown in high power insets to the right of each CAV images in order to illustrate inverse correlation between p-SMAD3 and LMO7 in representative individual cells. 20–32 cells in total from each of several sections from each patient sample were randomly selected for quantitation of the staining intensity of LMO7 and p-SMAD3 which are plotted in the lower graphs. In CAV samples, the average expression of LMO7 and p-SMAD3 from each patient sample was presented as a single data point in the correlation graphs to confirm the inverse correlation between LMO7 and p-SMAD3 in the diseased patient samples (each individual patient color coded in graphs for clarity). R2 and p value for correlation curve is shown. Data are expressed as mean ± S.E.M. ***P < 0.001, ****P < 0.0001.

References

    1. Dangas GD, Claessen BE, Caixeta A, Sanidas EA, Mintz GS and Mehran R. In-stent restenosis in the drug-eluting stent era. J Am Coll Cardiol 2010;56:1897–1907. - PubMed
    1. Owens GK, Kumar MS and Wamhoff BR. Molecular regulation of vascular smooth muscle cell differentiation in development and disease. Physiol Rev 2004;84:767–801. - PubMed
    1. Fattori R and Piva T. Drug-eluting stents in vascular intervention. Lancet 2003;361:247–249. - PubMed
    1. Leask A and Abraham DJ. TGF-beta signaling and the fibrotic response. FASEB J 2004;18:816–827. - PubMed
    1. Massagué J TGFβ signalling in context. Nat Rev Mol Cell Biol 2012;13:616–630. - PMC - PubMed

Publication types

MeSH terms