Clinical Trial
. 2019 Feb 26;139(9):1199-1216.
doi: 10.1161/CIRCULATIONAHA.118.036232.

Senescent Phenotype Induced by p90RSK-NRF2 Signaling Sensitizes Monocytes and Macrophages to Oxidative Stress in HIV-Positive Individuals

Affiliations
Clinical Trial

Senescent Phenotype Induced by p90RSK-NRF2 Signaling Sensitizes Monocytes and Macrophages to Oxidative Stress in HIV-Positive Individuals

Meera V Singh et al. Circulation. .

Abstract

Background: The incidence of cardiovascular disease is higher in HIV-positive (HIV+) patients than it is in the average population, and combination antiretroviral therapy (cART) is a recognized risk factor for cardiovascular disease. However, the molecular mechanisms that link cART and cardiovascular disease are currently unknown. Our study explores the role of the activation of p90RSK, a reactive oxygen species-sensitive kinase, in engendering senescent phenotype in macrophages and accelerating atherogenesis in patients undergoing cART.

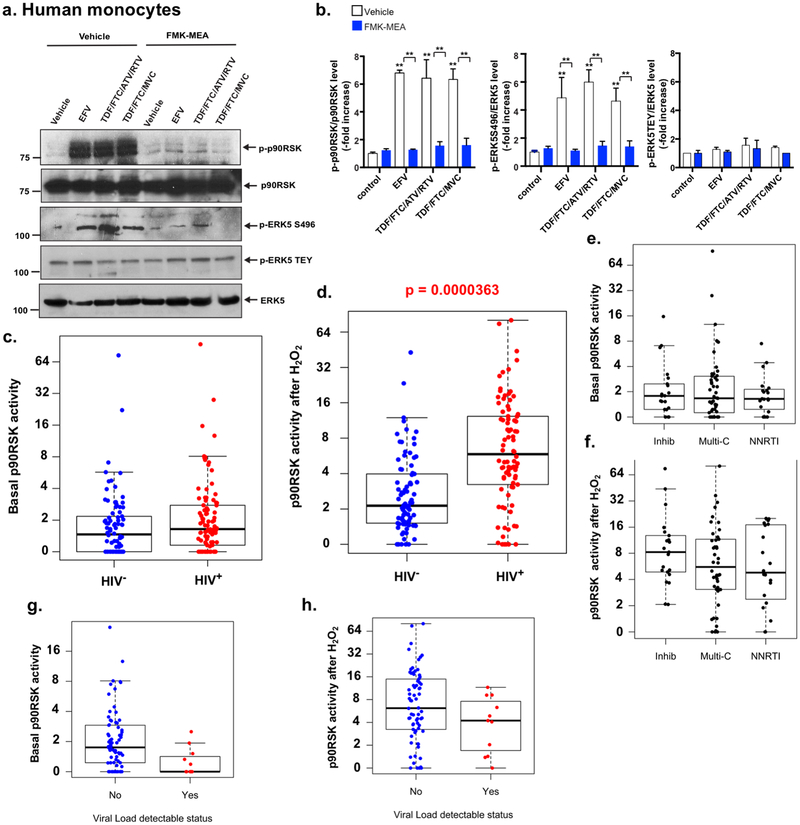
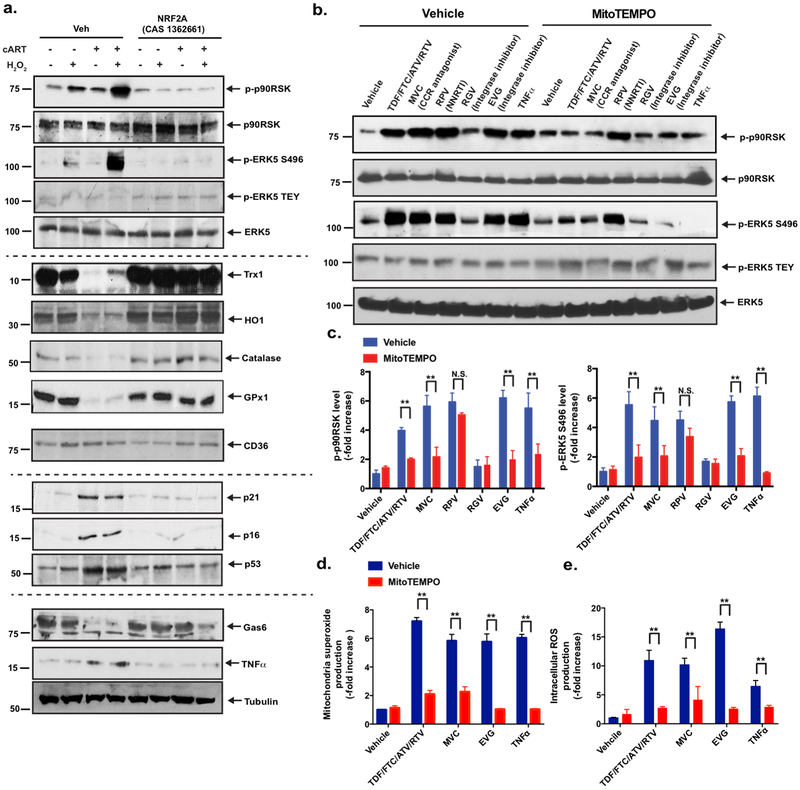
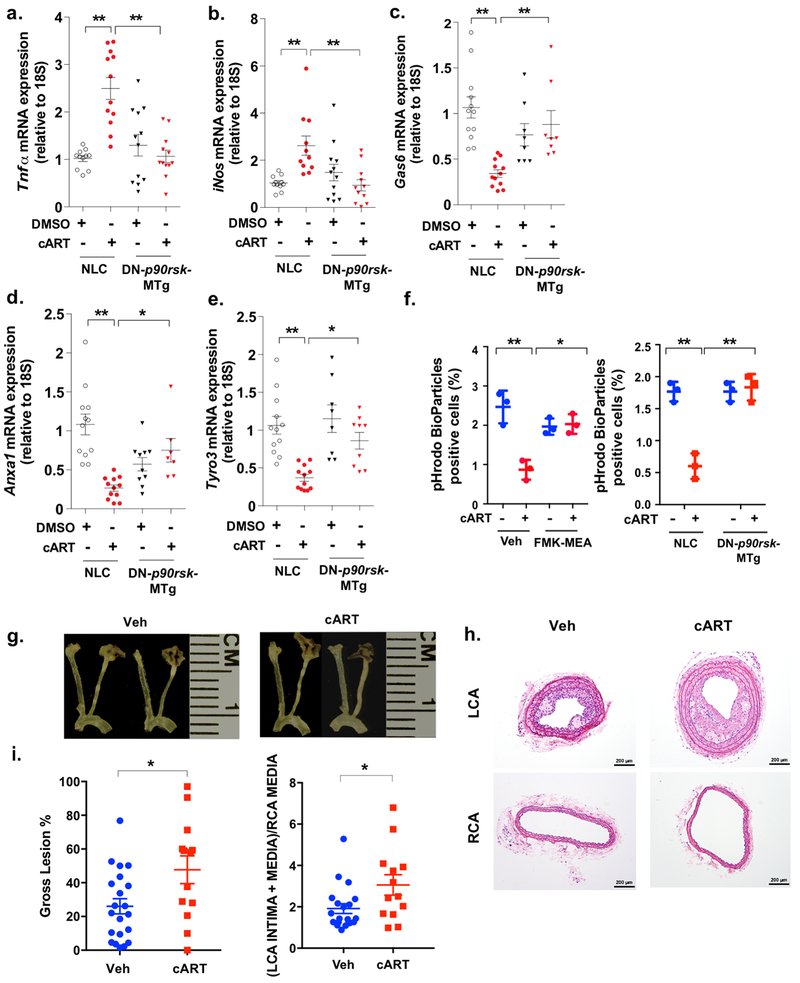
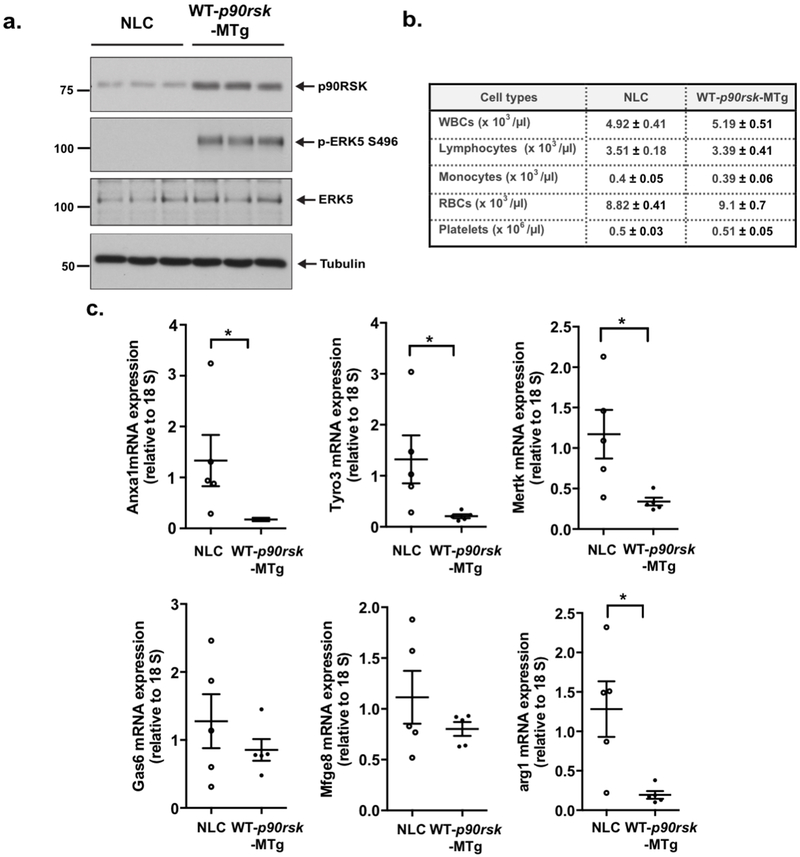
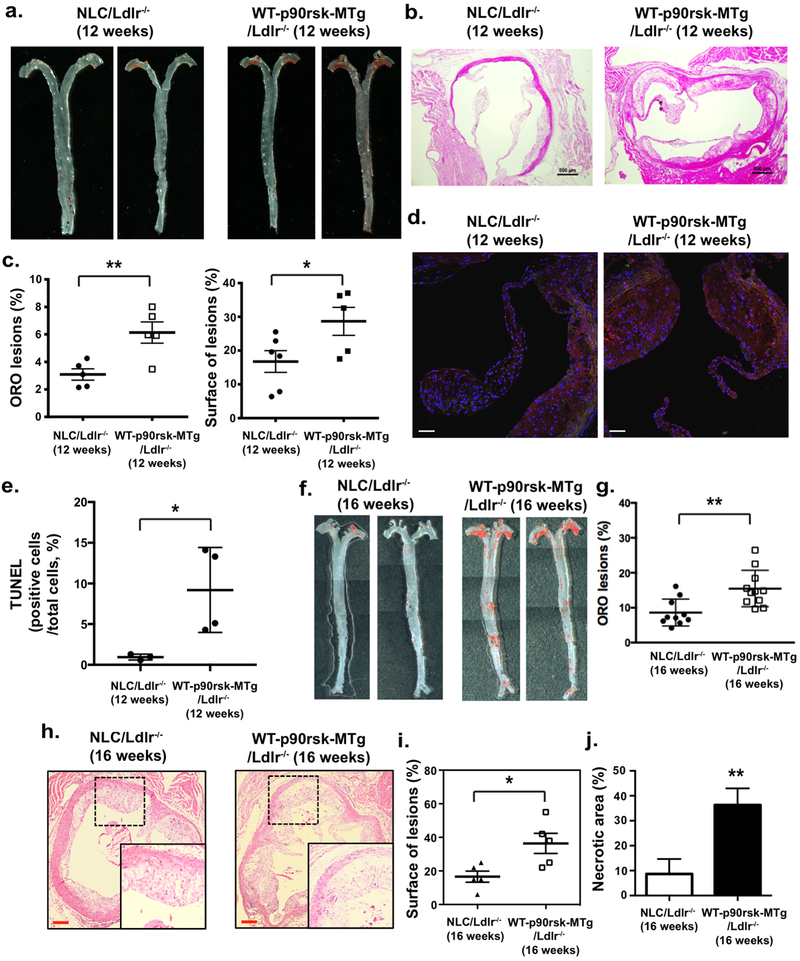
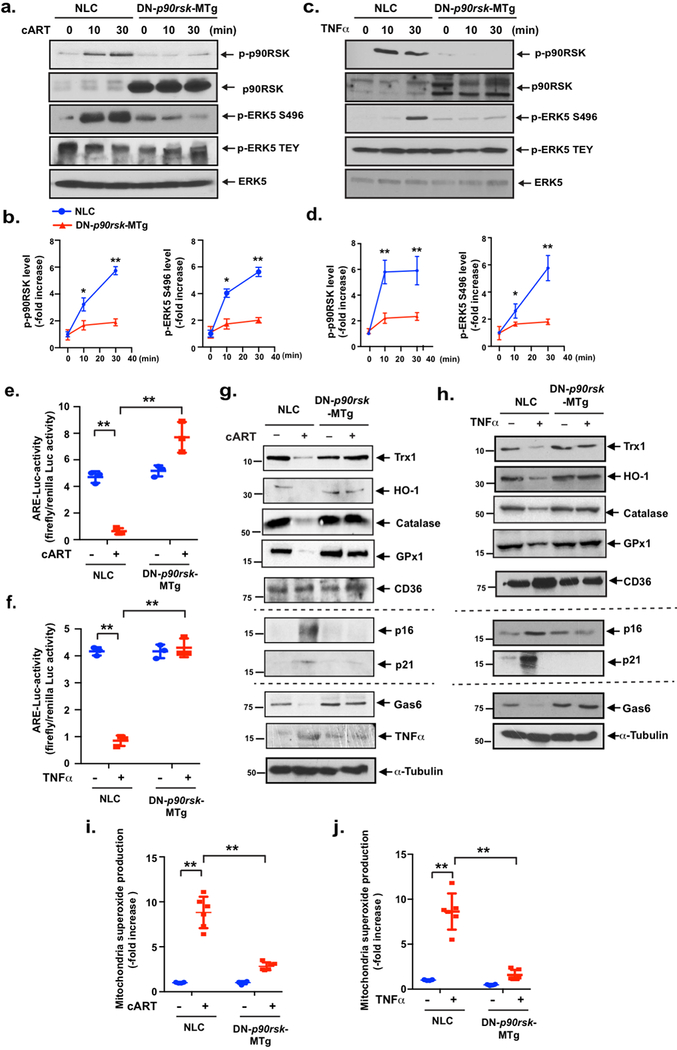
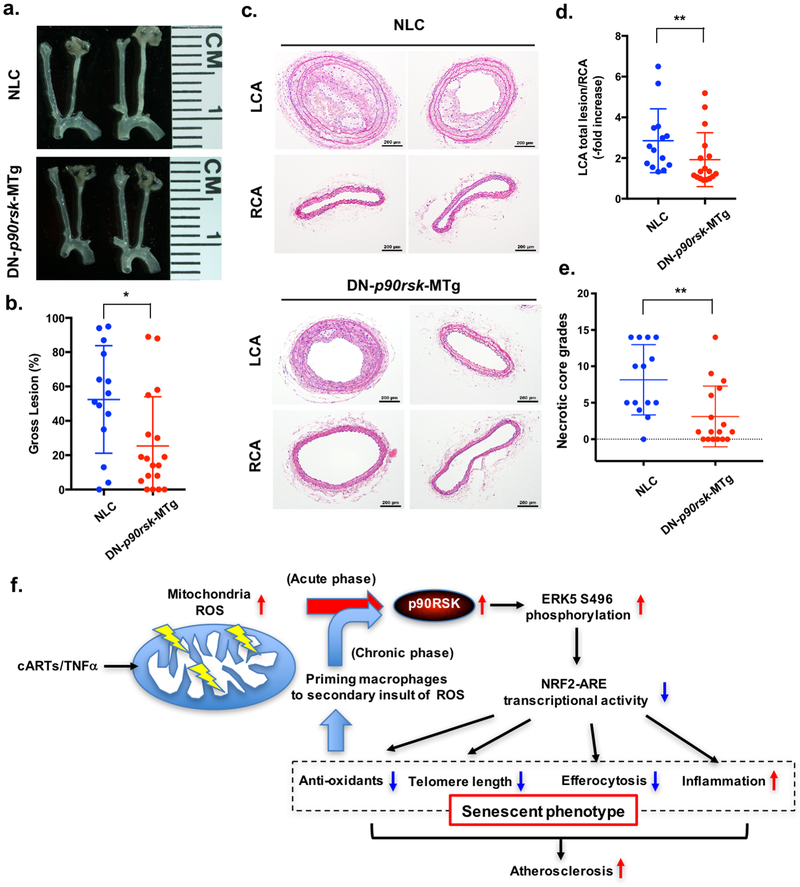
Methods: Peripheral whole blood from cART-treated HIV+ individuals and nontreated HIV-negative individuals was treated with H2O2 (200 µmol/L) for 4 minutes, and p90RSK activity in CD14+ monocytes was measured. Plaque formation in the carotids was also analyzed in these individuals. Macrophage senescence was determined by evaluating their efferocytotic ability, antioxidation-related molecule expression, telomere length, and inflammatory gene expression. The involvement of p90RSK-NRF2 signaling in cART-induced senescence was assessed by p90RSK-specific inhibitor (FMK-MEA) or dominant-negative p90RSK (DN-p90RSK) and NRF2 activator (NRF2A). Further, the severity of atherosclerosis was determined in myeloid cell-specific wild-type and DN-p90RSK transgenic mice.

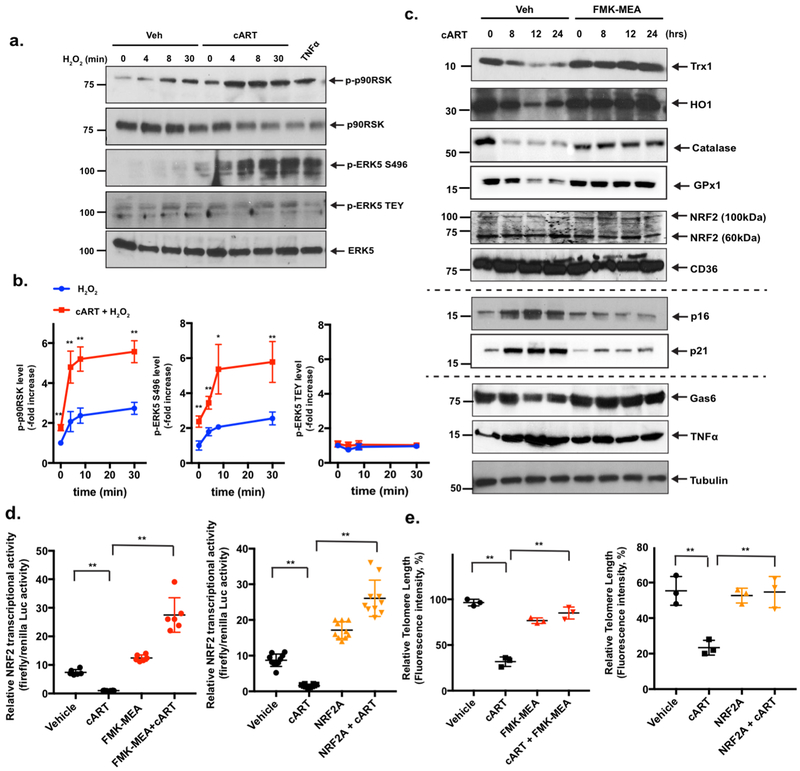
Results: Monocytes from HIV+ patients exhibited higher levels of p90RSK activity and were also more sensitive to reactive oxygen species than monocytes from HIV-negative individuals. A multiple linear regression analysis involving cART, Reynolds cardiovascular risk score, and basal p90RSK activity revealed that cART and basal p90RSK activity were the 2 significant determinants of plaque formation. Many of the antiretroviral drugs individually activated p90RSK, which simultaneously triggered all components of the macrophage senescent phenotype. cART inhibited antioxidant response element reporter activity via ERK5 S496 phosphorylation. NRF2A reversed the H2O2-induced overactivation of p90RSK in cART-treated macrophages by countering the induction of senescent phenotype. Last, the data obtained from our gain- or loss-of-function mice conclusively showed the crucial role of p90RSK in inducing senescent phenotype in macrophages and atherogenesis.

Conclusions: cART increased monocyte/macrophage sensitivity to reactive oxygen species- in HIV+ individuals by suppressing NRF2-ARE activity via p90RSK-mediated ERK5 S496 phosphorylation, which coordinately elicited senescent phenotypes and proinflammatory responses. As such, our report underscores the importance of p90RSK regulation in monocytes/macrophages as a viable biomarker and therapeutic target for preventing cardiovascular disease, especially in HIV+ patients treated with cART.

Keywords: HIV; antioxidants; atherosclerosis; reactive oxygen species; senescence; telomere.


Figures

Figure 1.
Figure 1.. cART and p90RSK activation in HIV+ patients.
(a) Human monocytes were pre-treated with a p90RSK-specific inhibitor of FMK-MEA (10 μM) or vehicle (DMSO, 0.1%) for 30 min and incubated with EFV (10 μM), TDF/FTC/ATV/RTV (10 μM each), TDF/FTC (10 μM each), or vehicle (DMSO, 0.1%) for 10 min. The cells were collected, and total p90RSK, p90RSK phosphorylation, ERK5 S496 phosphorylation, ERK5 TEY motif phosphorylation, and total ERK5 were detected by Western blotting with the indicated antibodies. Representative images from three independent experiments are shown. (b) Quantification of cART-induced p90RSK activation (S380 phosphorylation; left), ERK5 S496 phosphorylation (middle), and ERK5 activation (TEY motif phosphorylation; right) is shown after normalization by total protein levels. The data represent the mean±SD (n=3). **p<0.01. Blue bar: FMK-MEA pre-treatment, white bar: vehicle (DMSO) control pre-treatment. (c, d) The basal levels (c) and levels after H2O2 stimulation (d) of p90RSK activity in CD14+ peripheral blood monocytes from HIV+ and HIV patients. p90RSK activity was determined using the ratio between phosphorylated p90RSK and total p90RSK, detected by flow cytometry, as described in the Methods. The p90RSK activity after H2O2 stimulation was significantly higher (p=0.0000363) in the HIV+ group. No significant difference was detected in basal p90RSK activity. (e, f) The basal levels (e) and levels after H2O2 stimulation (f) of p90RSK activity in monocytes from HIV+ patients undergoing treatment with integrase inhibitors, multiple combination treatments, and NNRTI regimens, as described in the Methods. No significant difference was found among these three groups. (g, h) The basal levels (g) and levels after H2O2 stimulation (h) of p90RSK activity by viral load detectable status in the HIV+ group, as described in the Methods. Yes, n=11, No, n=74. The p90RSK activity in both basal (p=0.0012245) and H2O2-stimulated (p=0.0022490) samples was significantly higher in the no virus detectable group than those in the virus detectable group.
Figure 2.
Figure 2.. cART inhibits NRF2-ARE transcriptional activity, shortens TLs, and sensitizes macrophages to oxidative stress.
(a) BMDMs were pre-treated with cART (TDF/FTC/ATV/RTV, 10 μM each) or vehicle for 24 h, and cells were incubated with H2O2 (200 μM) for 0-30 min. p90RSK S380 phosphorylation, ERK5 TEY motif phosphorylation, ERK5-S496 phosphorylation, and ERK5, p90RSK, and tubulin expression were detected by Western blotting with specific antibodies. TNFα stimulation (20 ng/ml for 30 min) was used as the positive control. Representative images from three independent experiments are shown. (b) Quantification of p90RSK activation (S380 phosphorylation; left), ERK5 S496 phosphorylation (middle), and ERK5 TEY motif phosphorylation (right) is shown after normalization by total protein levels. The data are represented as the mean±SD. (n=3). **p<0.01 and *p<0.05. (c) BMDMs were pre-treated with FMK-MEA (10 μM) or vehicle for 1 h, and cells were incubated with cART (TDF/FTC/ATV/RTV, 10 μM each) for 0–24 h. Western blotting was performed using specific antibodies against the proteins indicated on the right. (d) BMDMs were transfected with the ARE luciferase reporter and the constitutively expressing Renilla luciferase vector for 16 h. Cells were pre-treated with FMK-MEA (10 μM; left [red]) for 1 h, NRF2 activator (NRF2A, CAS 1362661 [2 μM]; right [orange]) for 6 h, or vehicle control and then treated with vehicle or cART for 6 h. NRF2-ARE transcriptional activity was measured as described in the Methods. Mean±SD., **p<0.01. (e) BMDMs were pre-treated with FMK-MEA (10 μM; left [red]) for 1 h, NRF2 activator (NRF2A, CAS 1362661 [2 μM]; right [orange]) for 6 h, or vehicle, as in (l), and then treated with vehicle or cART for 18 h. TL lengths were determined by measuring the fluorescent telomeric signal intensity of the fluorescein-conjugated PNA probe, as described in the Methods. Results are represented as the relative TL length (%) (mean±SD). The TL length of human T-cell leukemia cell line (1301) cells was set to 100%. **p<0.01.
Figure 3.
Figure 3.. Roles of NRF2 and mitochondrial ROS in the expression of the cART-induced senescent phenotype and p90RSK-ERK5 S496 phosphorylation.
(a) BMDMs were pre-treated with NRF2A (CAS 1362661) or vehicle for 6 h and treated with cART or vehicle for 18 h, as in Fig. 2c. They were then incubated with H2O2 (200 μM) for 10 min. A Western blotting analysis was performed using specific antibodies against the proteins indicated on the right side of the panel. Representative images from three independent experiments are shown. (b, c) Various cART drugs increased p90RSK activity, ERK5 S496 phosphorylation, and ERK5 TEY motif phosphorylation via mitochondrial ROS production. BMDMs from C57Bl/6 mice were treated with MitoTEMPO (20 μM) for 1 h and incubated with various cART drugs, as indicated, for 10 min. A Western blotting analysis was performed using specific antibodies against the proteins indicated in the figure. (c) The graph represents densitometry data of immunoblots from three independent experiments (n=3) in (b), mean±SD. **p<0.01. (d, e) BMDMs from C57Bl/6 mice were incubated with various cART drugs and TNFα with vehicle or MitoTEMPO, as indicated. MitoSox Red (d) and H2DCF-DA (e) were added, and mitochondrial ROS (d) and intracellular ROS (e) levels were detected as described in the Methods. Mean±SD. (n=3), **p<0.01.
Figure 4.
Figure 4.. cART induces inflammation and inhibits efferocytosis-related gene expression via p90RSK activation and elevates atherosclerosis.
(a-e) BMDMs obtained from NLC and DN-p90rsk-MTg mice were stimulated with cART (red) or vehicle (black) for 16 h. RT-PCR (qRT-PCR) was performed for the five genes indicated, and the levels of expression of each gene were quantified relative to ribosomal 18S RNA. Means±SD. **p<0.01, *p<0.05. (f) BMDMs were pre-treated with FMK-MEA (10 μM) or vehicle for 1 h and treated with cART (red) or vehicle (blue) for 24 h. Cells were then incubated with the IncuCyte pHrodo-labeled apoptosis detection probe, and pHrodo-positive cells were quantified. Mean±SD. (n=3), **p<0.01. (g-i) PCL surgery was performed on the LCA. One week later, mice were treated with cART (TDF/FTC/ATV/RTV) or vehicle for 2 weeks, and the gross plaque size (g, i: left) was determined. Mean±SD. (n=13-20). (h, i: right) The plaque size after PCL in vehicle-treated (veh) and cART-treated Ldlr−/− mice was quantified as described in the Methods. Representative images are shown after H&E staining. Scale bars: 200 μm. (i: right, n=13-20).
Figure 5.
Figure 5.. Constitutive activation of p90RSK in macrophages down-regulates their expression of efferocytosis-related genes.
(a) p90RSK and ERK5 expression, ERK5 S496 phosphorylation, and tubulin expression were detected in PE macrophages isolated from NLC and WT-p90rsk-MTg mice. (b) Peripheral blood cell counts were performed in NLC and WT-p90rsk-MTg mice. Means±SD. (n=5). (c) Relative mRNA expression of efferocytosis-related genes in NLC and WT-p90rsk-MTg PE macrophages was determined by quantitative RT-PCR. Mean±SD., *p<0.05.
Figure 6.
Figure 6.. Overexpression of p90RSK in myeloid cells accelerates atherosclerosis and necrotic core formation.
NLC/Ldlr−/− and WT-p90rsk-MTg/Ldlr−/− mice were fed a high-fat diet for 12 weeks (a-e) or 16 weeks (f-j), respectively. WT-p90rsk-MTg/Ldlr−/− mice exhibited increased oil-red O-stained atherosclerotic lesions in the en face whole aorta (a, c: left, f, g) as well as increased H&E-stained sections of the aortic valve region (b, h). Scale bars: 500 μm. Quantified oil-red O-stained lesions (c: left, g) and histologically identified plaque areas (c: right, j) are shown. Mean±SD. (d) Sections of proximal aortas from each group were labeled using TUNEL reagents to detect apoptotic cells and counterstained with DAPI to detect nuclei. Scale bars: 50 μm. (e) The graph shows the percentage of TUNEL-positive cells (TUNEL+ cells/total cells counted) in the lesion area. Over 200 cells were counted for each group. *p<0.05. (j) The area occupied by the necrotic core (acellular lipid core) is shown as the percentage of the total lesion area. Data are expressed as means±SD. n=5 per genotype. **p<0.01.
Figure 7.
Figure 7.. cART-induced, CVD-associated phenotypes are reversed in BMDMs obtained from myeloid cells-specific DN-p90rsk-MTg mice.
(a-d) BMDMs from NLC and DN-p90rsk-MTg mice were incubated with cART (TDF/FTC/ATV/RTV, 10 μM each) (a) or TNFα (20 ng/ml) (c) for 0–30 min, and p90RSK activation (S380 phosphorylation), ERK5 S496 phosphorylation, ERK5 TEY motif phosphorylation, and total p90RSK and ERK5 expression were detected by Western blotting using specific antibodies, as indicated. (b, d) The graph represents the densitometry data of immunoblots (n=3), similar to those shown in (a) and (c). The data are the means±SD. **p<0.01 and *p<0.05. (e, f) BMDMs from NLC and DN-p90rsk-MTg mice were transfected with the ARE luciferase reporter and the constitutively expressing Renilla luciferase vector for 16 h. Cells were incubated with (e) cART (TDF/FTC/ATV/RTV, 10 μM each) or (f) TNFα (20 ng/ml) for 6 h, and NRF2-ARE transcriptional activity from three independent experiments was measured as described in the Methods. Mean±SD., **p<0.01. (g, h) BMDMs from NLC and DN-p90rsk-MTg mice were incubated with cART (TDF/FTC/ATV/RTV, 10 μM each) or TNFα (20 ng/ml) for 24 h. Western blotting was performed using antibodies against the indicated proteins. (i, j) BMDMs from NLC and DN-p90rsk-MTg mice were incubated with cART (TDF/FTC/ATV/RTV, 10 μM each) (i) or TNFα (20 ng/ml) (j) for 0 (−) or (+) 10 min. and then treated with MitoSOX Red for 10 min, and mitochondrial ROS levels were detected as described in the Methods. Mean±SD. (n=3), **p<0.01.
Figure 8.
Figure 8.. Atherosclerotic plaque formation is inhibited in myeloid-specific DN-p90rsk-MTg mice.
(a, b) Four weeks after the AAV/D377Y-mPCSK9 injection and after being fed a high-fat diet, NLC and DN-p90rsk-MTg mice underwent PCL of the LCA. After 4 weeks, mice were killed and their carotid arteries were harvested. Representative images are shown (a). The gross plaque size (plaque area/total left carotid area) was measured (b). Mean±SD. (n=10-13), *p<0.05. (c, d) H&E-stained cross-sections of the LCA and RCA in NLC and DN-p90rsk-MTg mice (c). The unligated RCA in each mouse was used as the control. Scale bars: 200 μm. The average plaque size was determined by the ratio of the LCA lesion area to RCA media in the cross-sections obtained from 5-10 different positions along the carotid arteries (d), as described in the Methods section and previously. (e) Necrotic core formation was quantified by a grading system, as described in the Methods. Mean±SD. (n=10-13), **p<0.01. (f) The scheme depicts the mechanisms and roles of p90RSK activation in cART/TNFα-induced atherosclerotic plaque formation. cART and TNFα activate p90RSK by inducing mitochondrial ROS production within 30 min after stimulation (acute phase) and subsequently promote ERK5 S496 phosphorylation and down-regulate NRF2-ARE transcriptional activity without affecting NRF2 and CD36 expression levels. This down-regulation of NRF2-ARE transcriptional activity leads to the up-regulation of 1) inflammation and 2) the expression of senescence-related molecules and the down-regulation of 3) efferocytosis and 4) antioxidant-related molecule expression. After 24 h of cART and TNFα stimulation of macrophages (chronic phase), monocytes and macrophages are sensitized to the secondary insult of ROS; this is completely lost after treatment with NRF2 activator, suggesting that the reduction in NRF2-ARE transcriptional activity, in particular antioxidants and TL shortening, contributes to cART/TNFα-mediated priming of monocytes and macrophages to a secondary insult by ROS.

Similar articles

Cited by

References

    1. van Sighem AI, Gras LA, Reiss P, Brinkman K, de Wolf F and study Anoc. Life expectancy of recently diagnosed asymptomatic HIV-infected patients approaches that of uninfected individuals. AIDS. 2010;24:1527–1535. - PubMed
    1. Cohen RA, Seider TR and Navia B. HIV effects on age-associated neurocognitive dysfunction: premature cognitive aging or neurodegenerative disease? Alzheimers Res Ther. 2015;7:37. - PMC - PubMed
    1. Monsuez JJ, Belin C and Bouchaud O. Microvascular Function in Aging Among Women Living with HIV. Curr HIV/AIDS Rep. 2016;13:392–398. - PubMed
    1. Boccara F Cardiovascular health in an aging HIV population. AIDS. 2017;31 Suppl 2:S157–S163. - PubMed
    1. Kaplan-Lewis E, Aberg JA and Lee M. Atherosclerotic Cardiovascular Disease and Anti-Retroviral Therapy. Curr HIV/AIDS Rep. 2016;13:297–308. - PubMed

Publication types

MeSH terms