. 2019 Mar 12;139(11):1407-1421.
doi: 10.1161/CIRCULATIONAHA.118.036652.

Short-Chain Fatty Acid Propionate Protects From Hypertensive Cardiovascular Damage

Affiliations

Short-Chain Fatty Acid Propionate Protects From Hypertensive Cardiovascular Damage

Hendrik Bartolomaeus et al. Circulation. .

Abstract

Background: Arterial hypertension and its organ sequelae show characteristics of T cell-mediated inflammatory diseases. Experimental anti-inflammatory therapies have been shown to ameliorate hypertensive end-organ damage. Recently, the CANTOS study (Canakinumab Antiinflammatory Thrombosis Outcome Study) targeting interleukin-1β demonstrated that anti-inflammatory therapy reduces cardiovascular risk. The gut microbiome plays a pivotal role in immune homeostasis and cardiovascular health. Short-chain fatty acids (SCFAs) are produced from dietary fiber by gut bacteria and affect host immune homeostasis. Here, we investigated effects of the SCFA propionate in 2 different mouse models of hypertensive cardiovascular damage.

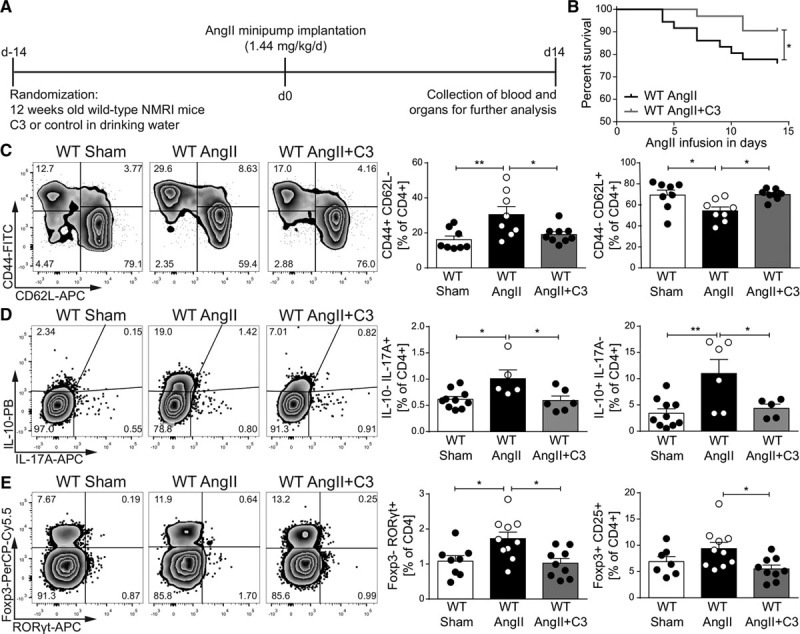
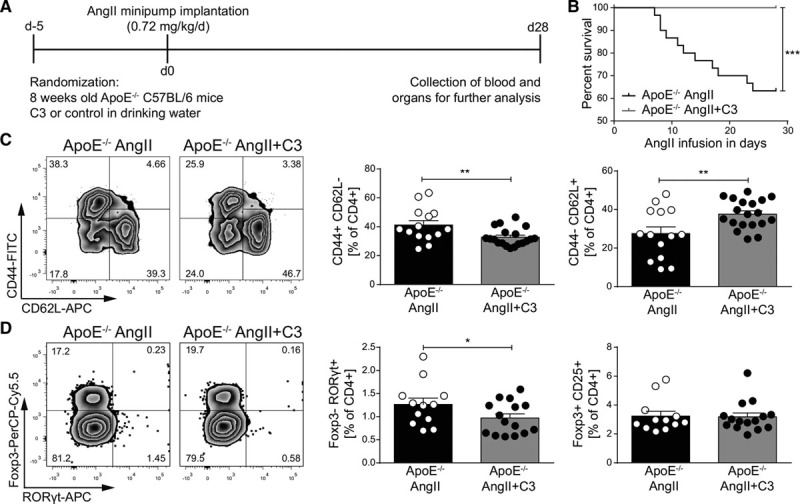
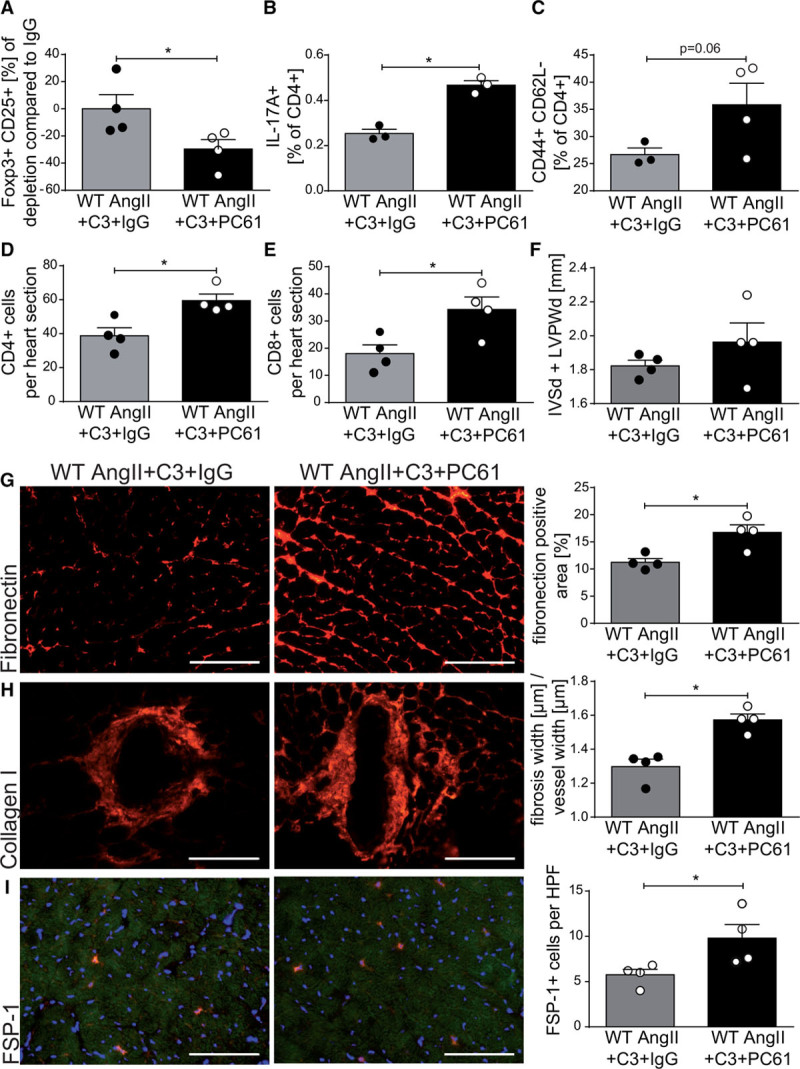
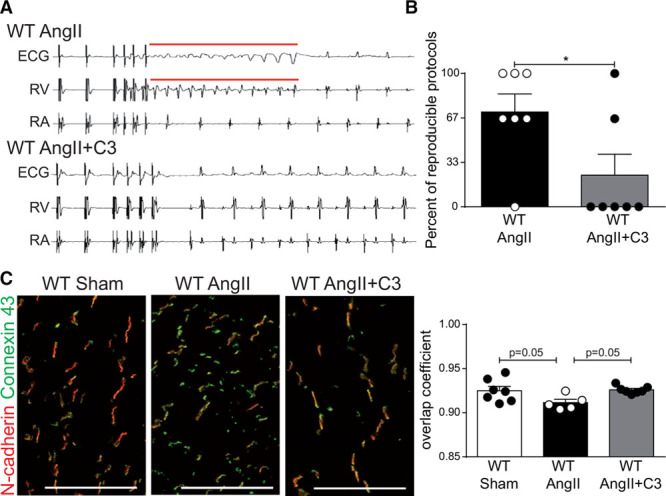
Methods: To investigate the effect of SCFAs on hypertensive cardiac damage and atherosclerosis, wild-type NMRI or apolipoprotein E knockout-deficient mice received propionate (200 mmol/L) or control in the drinking water. To induce hypertension, wild-type NMRI mice were infused with angiotensin II (1.44 mg·kg-1·d-1 subcutaneous) for 14 days. To accelerate the development of atherosclerosis, apolipoprotein E knockout mice were infused with angiotensin II (0.72 mg·kg-1·d-1 subcutaneous) for 28 days. Cardiac damage and atherosclerosis were assessed using histology, echocardiography, in vivo electrophysiology, immunofluorescence, and flow cytometry. Blood pressure was measured by radiotelemetry. Regulatory T cell depletion using PC61 antibody was used to examine the mode of action of propionate.

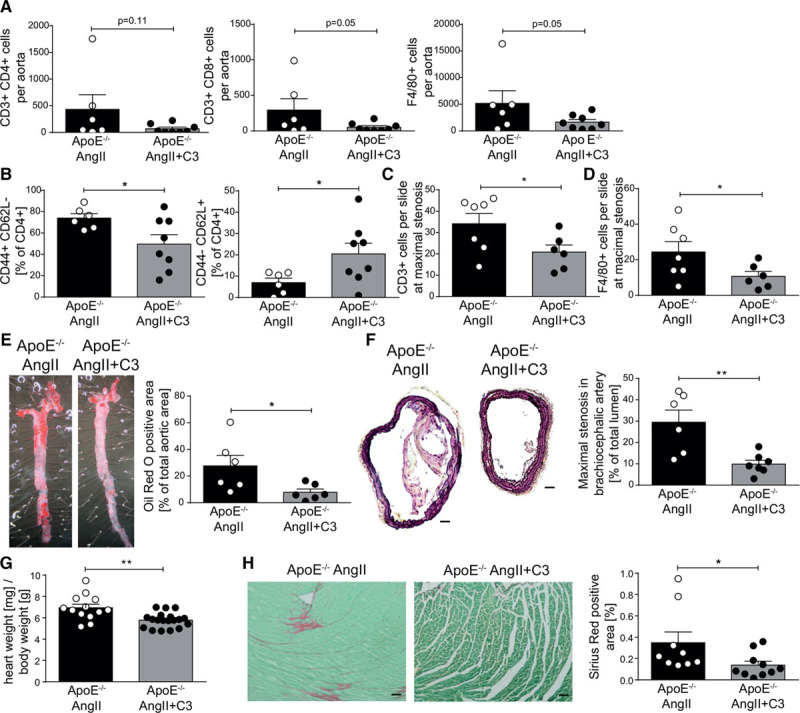
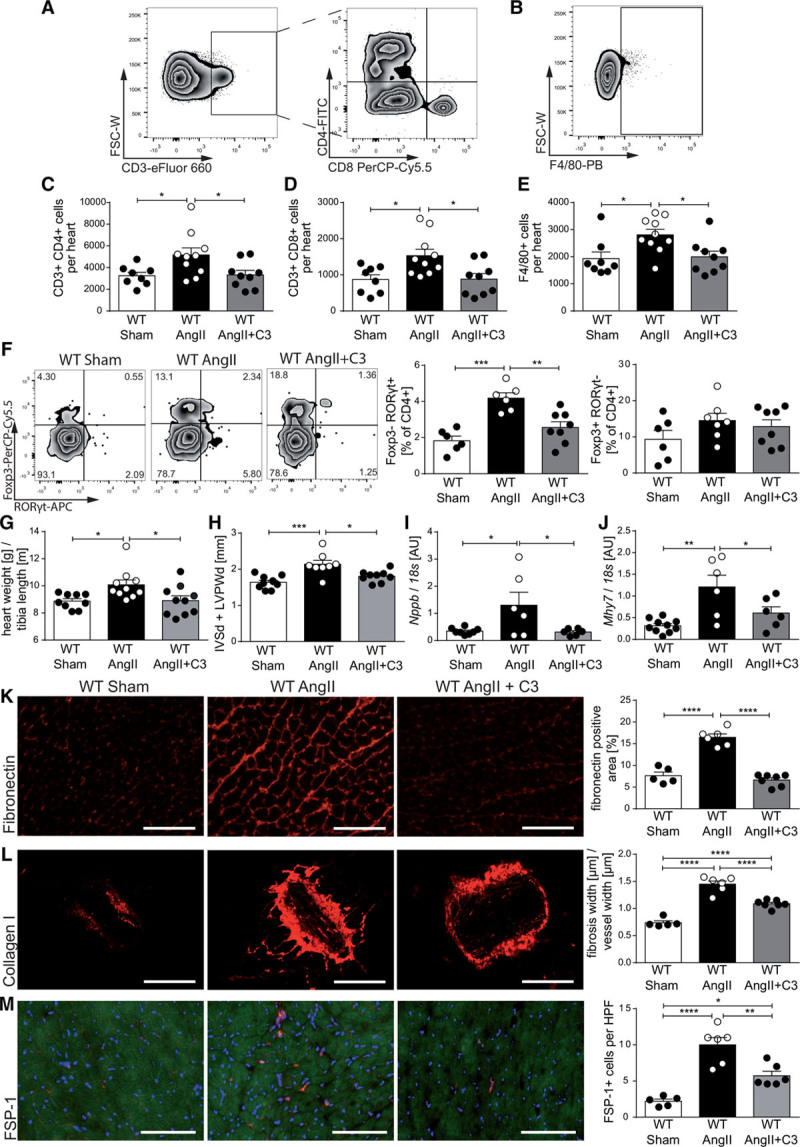
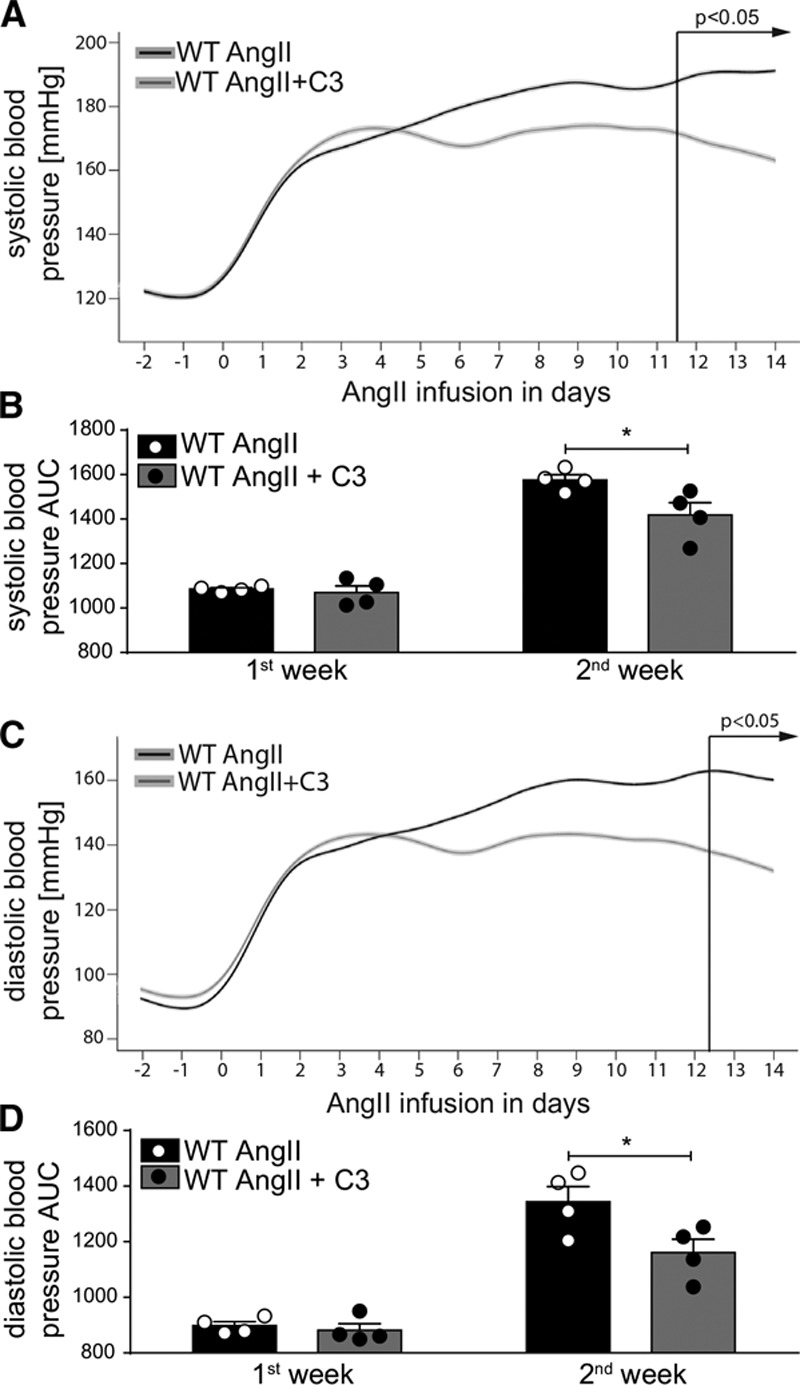
Results: Propionate significantly attenuated cardiac hypertrophy, fibrosis, vascular dysfunction, and hypertension in both models. Susceptibility to cardiac ventricular arrhythmias was significantly reduced in propionate-treated angiotensin II-infused wild-type NMRI mice. Aortic atherosclerotic lesion area was significantly decreased in propionate-treated apolipoprotein E knockout-deficient mice. Systemic inflammation was mitigated by propionate treatment, quantified as a reduction in splenic effector memory T cell frequencies and splenic T helper 17 cells in both models, and a decrease in local cardiac immune cell infiltration in wild-type NMRI mice. Cardioprotective effects of propionate were abrogated in regulatory T cell-depleted angiotensin II-infused mice, suggesting the effect is regulatory T cell-dependent.

Conclusions: Our data emphasize an immune-modulatory role of SCFAs and their importance for cardiovascular health. The data suggest that lifestyle modifications leading to augmented SCFA production could be a beneficial nonpharmacological preventive strategy for patients with hypertensive cardiovascular disease.

Keywords: T-lymphocytes, regulatory; Th17 cells; angiotensin II; apolipoproteins E; fatty acids, volatile; immunology; inflammation; microbiota.


Figures

Figure 1.
Figure 1.
Propionate provides beneficial modulation of effector T cells in AngII-infused wild-type NMRI (WT) mice. A, AngII-infused WT mice were treated with sodium propionate (C3) or sodium chloride as a control, starting 2 weeks before AngII infusion. Saline-infused mice served as nonhypertensive control group (sham). B, Survival curves of AngII-infused WT mice treated with C3 or control. WT AngII n=36, WT AngII+C3 n=31, *P<0.05 by log-rank test. C, After 14 days of AngII, splenocytes were analyzed for CD4+ effector memory (CD44+CD62L) and naive (CD44 CD62L+) subsets. Left, Representative flow cytometry plots. Right, Quantification in percentage of CD4+ cells. WT Sham n=8, WT AngII n=8, WT AngII+C3 n=9. D, Restimulated splenocytes were analyzed for IL-10 and IL-17A by flow cytometry. Left, Representative flow cytometry plots. Right, Quantification in percentage of CD4+. WT Sham n=10, WT AngII n=5 to 6, WT AngII+C3 n=5 to 6. E, Quantification of FoxP3+CD25+ and RORγt+ in CD4+ splenocytes. Left, Representative flow cytometry plots. Right, Quantification in percentage of CD4+. WT Sham n=7 to 8, WT AngII n=10, WT AngII+C3 n=9. *P<0.05, **P<0.01, 1-way ANOVA and Tukey post hoc for C through E. AngII indicates angiotensin II; APC, Allophycocyanin; FITC, fluorescein isothiocyanate; IL, interleukin; PB, Pacific Blue; and PerCP-Cy5.5, Peridinin-chlorophyll protein cyanine 5.5.
Figure 2.
Figure 2.
Propionate provides beneficial modulation of effector T cells in AngII-infused ApoE–/– mice. A, AngII-infused ApoE–/– mice were treated with C3 or sodium chloride, starting 5 days before minipump implantation. B, Survival curves of AngII-infused ApoE–/– mice treated with C3 or control. n=30 per group, ***P<0.001 by log-rank test. C, After 28 days of AngII infusion, splenocytes were analyzed for CD4+ effector memory (CD44+CD62L) and naive (CD44CD62L+) subsets. Left, Representative flow cytometry plots. Right, Quantification in percentage of CD4+. ApoE–/– AngII n=15, ApoE–/– AngII+C3 n=19. D, Quantification of FoxP3+CD25+ and RORγt+ in CD4+ splenocytes. Left, Representative flow cytometry plots. Right, Quantification in percentage of CD4+. ApoE–/– AngII n=12, ApoE–/– AngII+C3 n=15. *P<0.05, **P<0.01, by 1-tailed t test. AngII indicates angiotensin II; APC, Allophycocyanin; ApoE–/–, apolipoprotein E knockout–deficient; C3, propionate; FITC, fluorescein isothiocyanate; and PerCP-Cy5.5, Peridinin-chlorophyll protein cyanine 5.5.
Figure 3.
Figure 3.
Propionate reduces aortic inflammation and atherosclerotic lesion burden in AngII-infused ApoE–/–. A,Single-cell suspensions from whole aortas of were analyzed for T helper (CD3+CD4+), cytotoxic T cells (CD3+CD8+), and macrophages (F4/80+) by flow cytometry. B, Aortic CD4+ T cells were analyzed for CD4+ effector memory (CD44+CD62L) and naive (CD44CD62L+) subsets by flow cytometry. C and D, Quantification of CD3 and F4/80 positive cells in sections of the brachiocephalic artery, respectively. E, En face Oil Red O staining of whole aortas for the quantification of atherosclerotic lesion burden. Left, Representative aortas. Right, Quantification. F, The degree of stenosis in the brachiocephalic artery was determined in Movat-stained cross-sections. Left, Representative sections (scale bar=100 µm). Right, Quantification. Athrough F, ApoE–/– AngII n=6, ApoE–/– AngII+C3 n=8. G, Cardiac hypertrophy index (heart weight [mg]/body weight [g]) of AngII-infused ApoE–/– mice treated with C3 or control, ApoE–/– AngII n=16, ApoE–/– AngII+C3 n=21. H, Left ventricular cardiac fibrosis as analyzed by Sirius red staining. Left, Representative photomicrographs (scale bar=100 µm). Right, Quantification. ApoE–/– AngII n=9, ApoE–/– AngII+C3 n=10. *P<0.05, **P<0.01 by 1-tailed t test or Mann-Whitney test. AngII indicates angiotensin II; ApoE–/–, apolipoprotein E knockout–deficient; and C3, propionate.
Figure 4.
Figure 4.
Propionate attenuates hypertensive cardiac damage in AngII-infused wild-type NMRI (WT) mice. A through E, Single cells were isolated from hearts of sham-infused or AngII-infused WT mice treated with C3 or control and analyzed by flow cytometry for T helper cells (CD3+CD4+), cytotoxic T cells (CD3+CD8+), and macrophages (F4/80+), as well. A and B, Representative ratings. C through E, The respective quantifications. WT Sham n=8, WT AngII n=10, WT AngII+C3 n=9. F, Analysis of CD4+FoxP3+ and CD4+RORγt+ cells in heart single-cell suspensions. Left, Representative flow cytometry plots. Right, Quantifications. WT Sham n=6, WT AngII n=6 to 7, WT AngII+C3 n=8. G, Cardiac hypertrophy index (heart weight [g]/tibia length [m]), (WT Sham n=9, WT AngII n=10, WT AngII+C3 n=10). H, Left ventricular wall thickness (sum of IVSd and LVPWd) as measured by echocardiography (WT Sham n=9, WT AngII n=8, WT AngII+C3 n=9). Cardiac Nppb (I) and Mhy7 (J) expression as measured by qPCR at the end of the treatment (WT Sham n=10, WT AngII n=6, WT AngII+C3 n=6). K through M, Immunofluorescence analysis of cardiac left ventricular fibrosis using fibronectin (K), collagen I (L), and FSP-1 (M) antibodies (WT Sham n=5, WT AngII n=6, WT AngII+C3 n=7). Left, Representative photomicrographs (scale bar=100 µm). Right, Quantifications. *P<0.05, **P<0.01, ***P<0.001, ****P<0.0001 by 1-way ANOVA and Tukey post hoc. AngII indicates angiotensin II; APC, Allophycocyanin; AU, arbitrary unit; C3, propionate; FITC, fluorescein isothiocyanate; FSC-W, forward scatter width; FSP-1, fibroblast-specific protein 1; HPF, high-power field; IVSd, interventricular septal thickness at diastole; LVPWd, left ventricular posterior wall end diastole; PB, Pacific Blue; PerCP-Cy5.5, Peridinin-chlorophyll protein cyanine 5.5; and qPCR, quantitative polymerase chain reaction.
Figure 5.
Figure 5.
Depletion of regulatory T cells abrogates the effect of propionate in AngII-infused wild-type NMRI (WT) mice. AngII-infused WT mice received propionate treatment with intraperitoneal injections of anti-CD25 (PC61) or IgG control. A, Relative reduction in splenic CD4+CD25+Foxp3+ regulatory T cells at day 14 of AngII infusion in comparison with IgG control. B, IL-17A production in CD4+ restimulated splenocytes measured by flow cytometry. C, Splenic effector memory T cell (CD4+CD44+CD62L) frequencies. D and E, Analysis of CD4+ (D) and CD8+ (E) lymphocytes in heart sections using immunofluorescence. F, Left ventricular wall thickness (sum of IVSd and LVPWd) as measured by echocardiography. G through I, Immunofluorescence analysis of left ventricular fibrosis using fibronectin (G), collagen I (H), and FSP-1 (I) antibodies. Left, Representative photomicrographs (scale bars=100 µm). Right, quantification. A, D through I, WT AngII+C3+IgG n=4, WT AngII+C3+PC61 n=4; B and C, WT AngII+C3+IgG n=3, WT AngII+C3+PC61 n=4, *P<0.05 by 1-tailed Mann-Whitney test. AngII indicates angiotensin II; C3, propionate; FSP-1, fibroblast-specific protein 1; IgG, immunoglobulin G; IL, interleukin; IVSd, interventricular septal thickness at diastole; and LVPWd, left ventricular posterior wall end diastole.
Figure 6.
Figure 6.
Propionate treatment shows a blood pressure–lowering effect confined to the second week of AngII infusion. A through D, Systolic and diastolic blood pressure were measured continuously by radiotelemetry in AngII-infused WT mice treated with C3 or control. A and C, Shown are smoothened curves over time for systolic and diastolic blood pressure, respectively. P values by linear mixed model. B and D, Shown are systolic and diastolic pressures calculated as AUC in week 1 and week 2 of AngII infusion, respectively. n=4 per group. *P<0.05 by 2-way repeated-measurement ANOVA and Sidak post hoc. AngII indicates angiotensin II; AUC, area under the curve; C3, propionate; and WT, wild-type NMRI.
Figure 7.
Figure 7.
Propionate reduces susceptibility to ventricular arrhythmias in AngII-infused wild-type NMRI (WT) mice. In vivo programmed electric ventricular stimulations were performed in AngII-infused WT mice treated with C3 or control. A, Representative original tracings showing the induction of ventricular tachyarrhythmia. Surface ECG, right ventricular (RV), and right atrial (RA) recordings are shown. B, Quantification of ventricular arrhythmias susceptibility. n=7 per group, *P<0.05 by Mann-Whitney test. C, Immunofluorescent costaining of connexin 43 (green) and N-cadherin (red) in cardiac cryosections from sham-infused or AngII-infused WT mice treated with C3 or control. WT Sham n=7, WT AngII n=5, WT AngII+C3 n=7. Representative photomicrographs (scale bar=100 µm) and quantification of colocalization. P values by 1-way ANOVA and Tukey post hoc. AngII indicates angiotensin II; and C3, propionate.

Similar articles

Cited by

References

    1. Wenzel U, Turner JE, Krebs C, Kurts C, Harrison DG, Ehmke H. Immune mechanisms in arterial hypertension. J Am Soc Nephrol. 2016;27:677–686. doi: 10.1681/ASN.2015050562. - PMC - PubMed
    1. Rudemiller NP, Crowley SD. Interactions between the immune and the renin-angiotensin systems in hypertension. Hypertension. 2016;68:289–296. doi: 10.1161/HYPERTENSIONAHA.116.06591. - PMC - PubMed
    1. Itani HA, Harrison DG. Memories that last in hypertension. Am J Physiol Renal Physiol. 2015;308:F1197–F1199. doi: 10.1152/ajprenal.00633.2014. - PMC - PubMed
    1. Markó L, Kvakan H, Park JK, Qadri F, Spallek B, Binger KJ, Bowman EP, Kleinewietfeld M, Fokuhl V, Dechend R, Müller DN. Interferon-γ signaling inhibition ameliorates angiotensin II-induced cardiac damage. Hypertension. 2012;60:1430–1436. doi: 10.1161/HYPERTENSIONAHA.112.199265. - PubMed
    1. Madhur MS, Lob HE, McCann LA, Iwakura Y, Blinder Y, Guzik TJ, Harrison DG. Interleukin 17 promotes angiotensin II-induced hypertension and vascular dysfunction. Hypertension. 2010;55:500–507. doi: 10.1161/HYPERTENSIONAHA.109.145094. - PMC - PubMed

Publication types

MeSH terms