

Seasonal dynamics of influenza in Brazil: the latitude effect
- PMID: 30587159
- PMCID: PMC6307116
- DOI: 10.1186/s12879-018-3484-z
Seasonal dynamics of influenza in Brazil: the latitude effect
Erratum in
-
Correction to: Seasonal dynamics of influenza in Brazil: the latitude effect.BMC Infect Dis. 2019 Mar 4;19(1):225. doi: 10.1186/s12879-019-3739-3. BMC Infect Dis. 2019. PMID: 30832610 Free PMC article.
Abstract
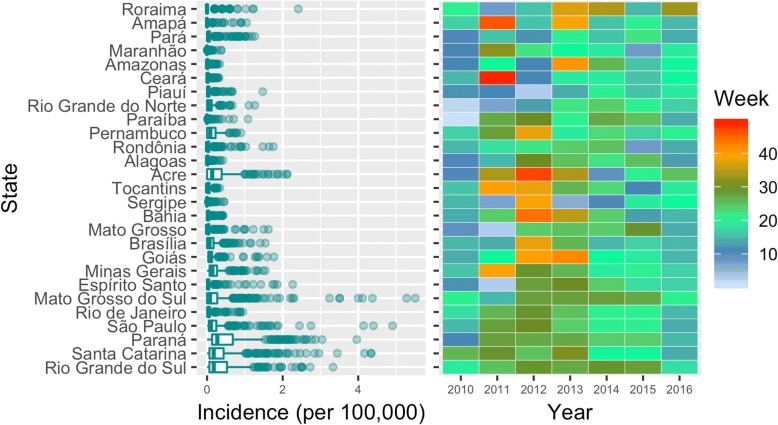
Background: Influenza is a global transmissible disease. Its dynamics is far better understood in temperate climates than in the tropics. We aim to close this knowledge gap between tropical and temperate regions by showing how the influenza seasonality evolves in Brazil, a tropical country that encompasses a wide range of latitudes and six climatic sub-types.
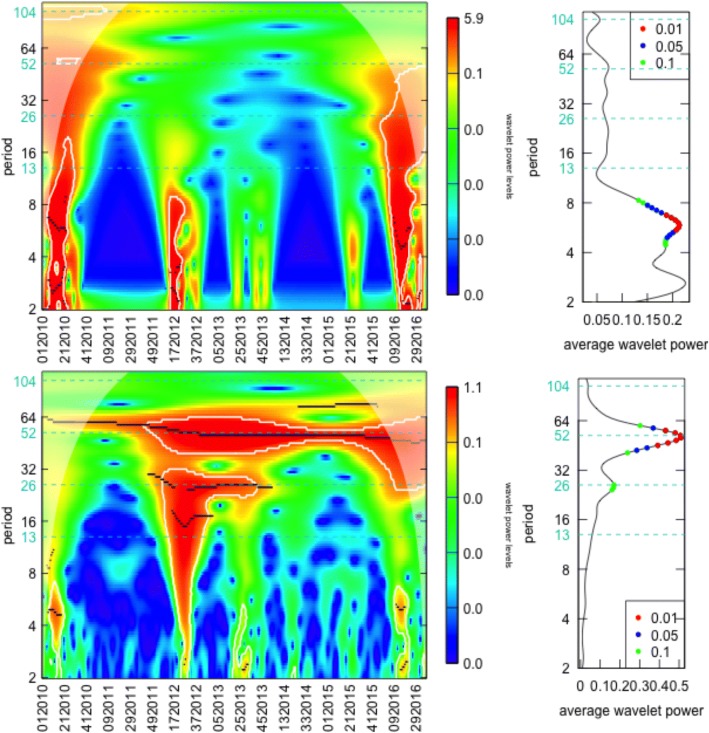
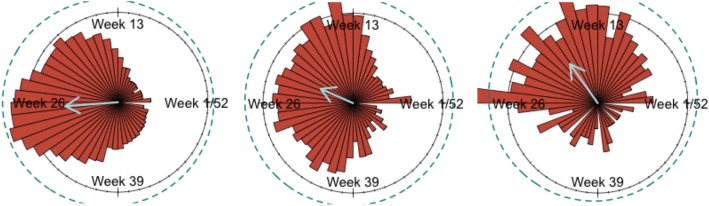
Methods: We analyzed a state-level, weekly Syndrome of Acute Respiratory Disease (SARI) incidence data ranging from 2010 to 2016. We combined two techniques hierarchically: first the wavelet decomposition technique to detect annual periodicity and then circular statistics to describe seasonal measures of the periodic states.
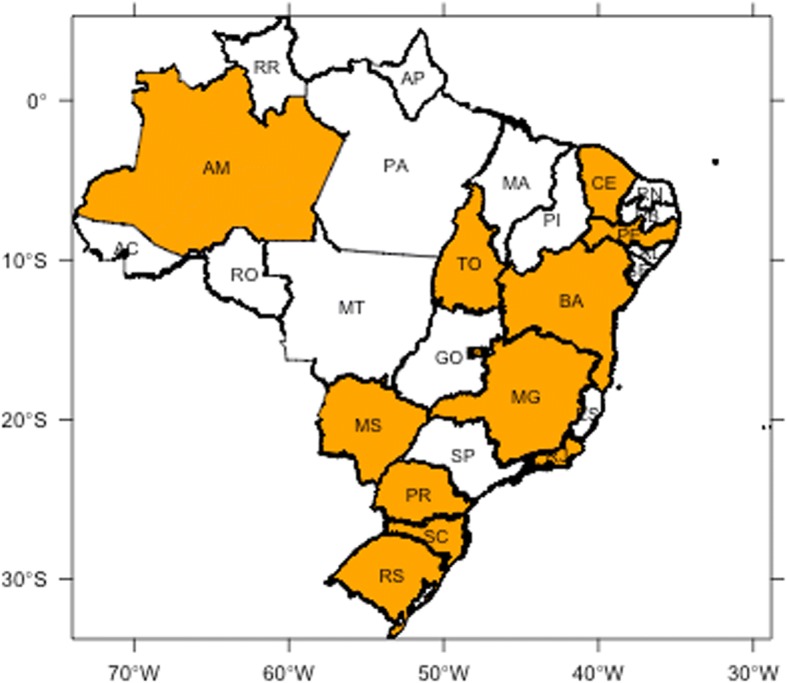
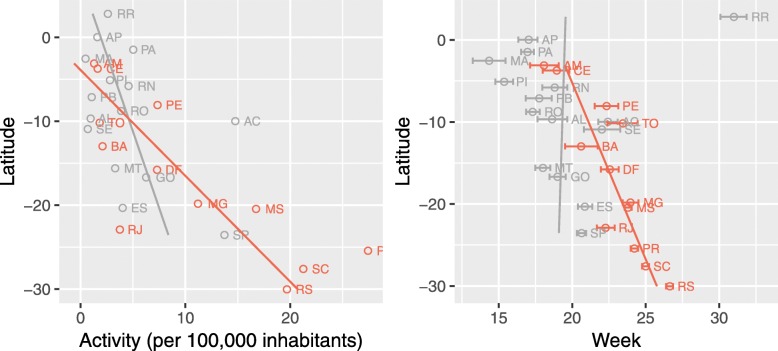
Results: We found significant annual periodicity in 44% of the states. For these, we calculated several seasonal measures such as the center of gravity or mean timing of activity. The relationship between the seasonal signatures and latitude was clear and statistically significant. States with seasonal signature are clustered along the coast. Most Amazonian and Central West states exhibit no seasonal behavior. Among the seasonal states, influenza starts in Northeast region, spreading southbound.
Conclusions: Our study advances the comprehension of influenza seasonality in tropical areas and could be used to design more effective prevention and control strategies.
Keywords: Circular; Influenza; Seasonality; Wavelet decomposition.
Conflict of interest statement
Ethics approval and consent to participate
Ethical approval was not required for this study as it uses secondary data.
Consent for publication
This study does not include any identifying data and thus does not require a consent to publish.
Competing interests
The authors declare that they have no competing interests.
Publisher’s Note
Springer Nature remains neutral with regard to jurisdictional claims in published maps and institutional affiliations.
Figures
References
-
- WHO . Influenza. 2003.
-
- WHO . WHO recommendations on the composition of influenza virus vaccines. 2017.
-
- WHO . Influenza (Seasonal) - Fact sheets. 2014.
-
- Paget J, Marquet R, Meijer A, van der Velden K. Influenza activity in Europe during eight seasons (1999–2007): an evaluation of the indicators used to measure activity and an assessment of the timing, length and course of peak activity (spread) across Europe. BMC Infect Dis. 2007;7:141. doi: 10.1186/1471-2334-7-141. - DOI - PMC - PubMed
-
- Soebiyanto RP, Gross D, Jorgensen P, Buda S, Bromberg M, Kaufman Z, Prosenc K, Socan M, Vega Alonso T, Widdow-son M-A, Kiang RK. Associations between Meteorological Parameters and Influenza Activity in Berlin (Germany), Ljubljana (Slovenia), Castile and León (Spain) and Israeli Districts. PLoS One. 2015;10:e0134701. doi: 10.1371/journal.pone.0134701. - DOI - PMC - PubMed
MeSH terms
LinkOut - more resources
Full Text Sources
Medical
Miscellaneous
