

Rhizosphere microorganisms can influence the timing of plant flowering
- PMID: 30587246
- PMCID: PMC6307273
- DOI: 10.1186/s40168-018-0615-0
Rhizosphere microorganisms can influence the timing of plant flowering
Abstract
Background: Plant phenology has crucial biological, physical, and chemical effects on the biosphere. Phenological drivers have largely been studied, but the role of plant microbiota, particularly rhizosphere microbiota, has not been considered.
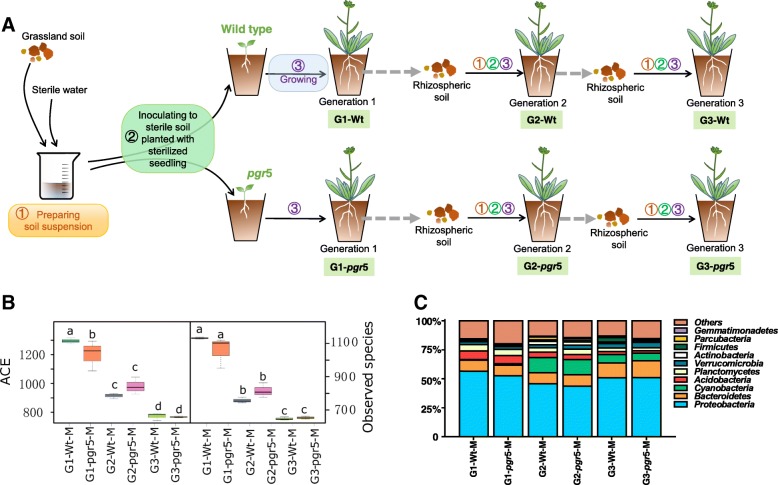
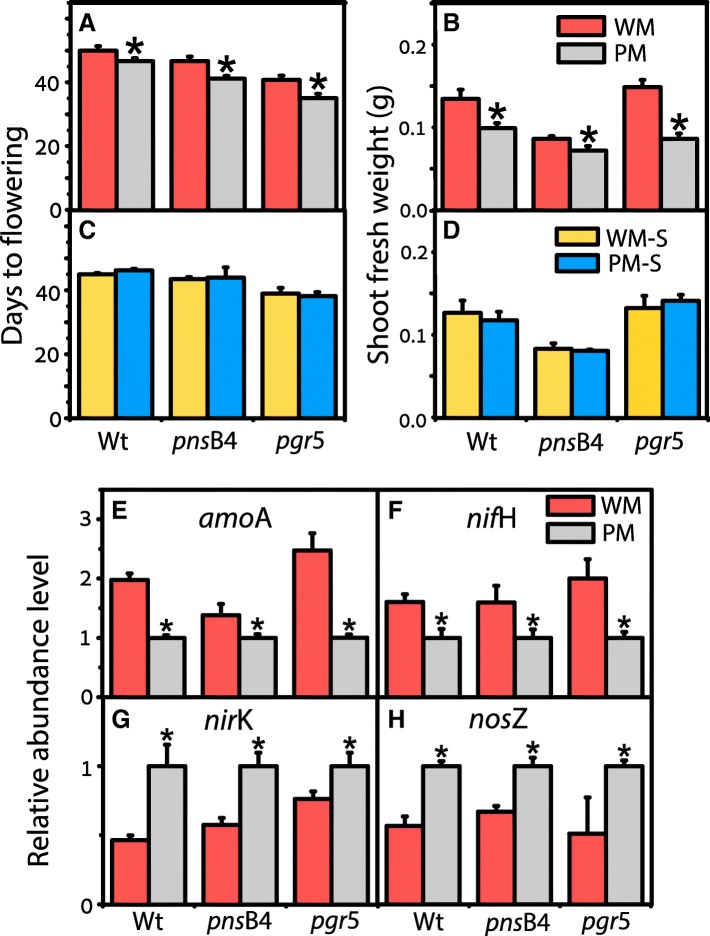
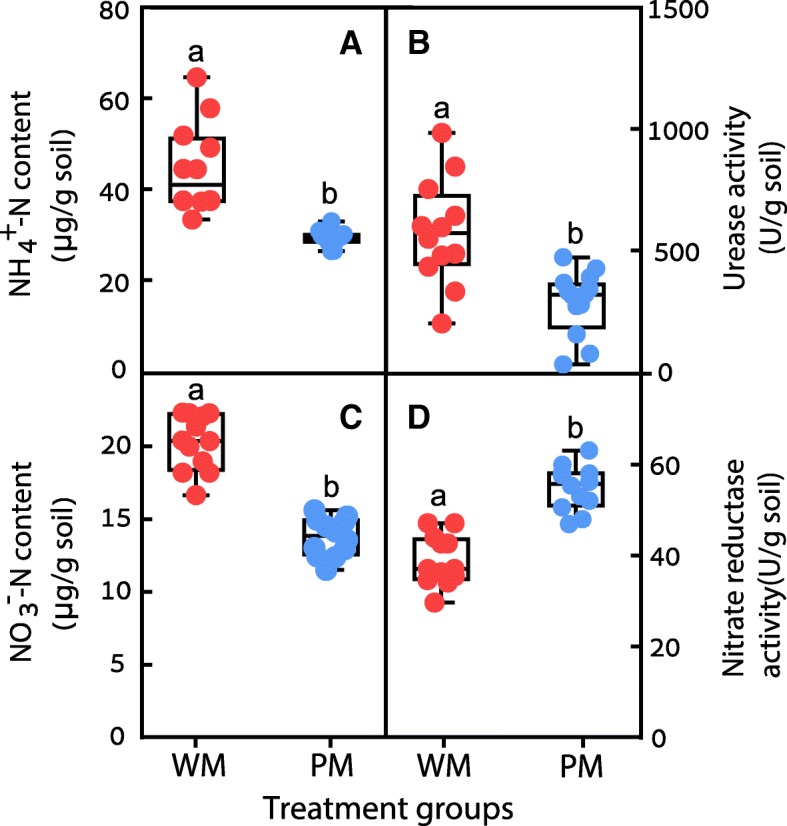
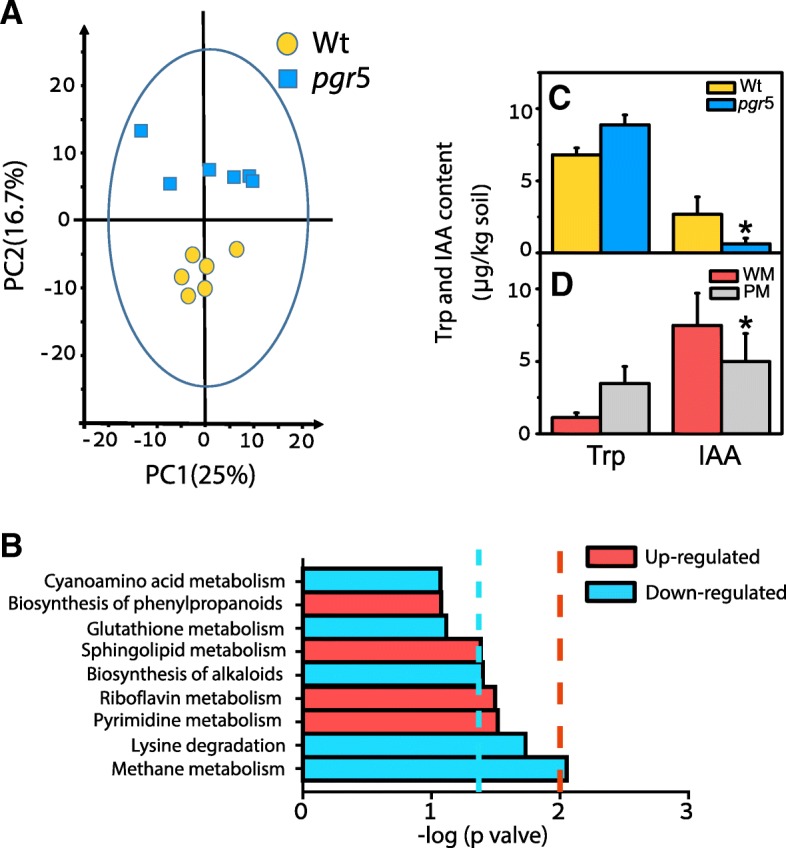
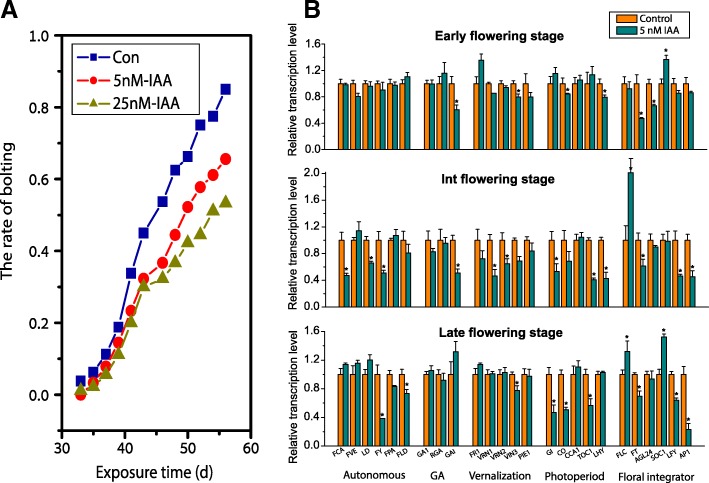
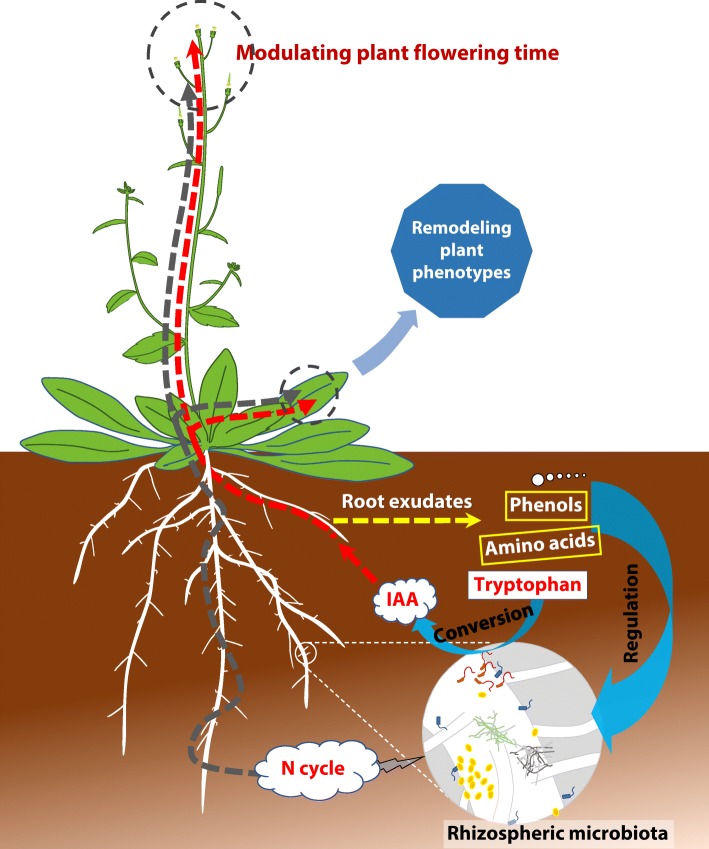
Results: We discovered that rhizosphere microbial communities could modulate the timing of flowering of Arabidopsis thaliana. Rhizosphere microorganisms that increased and prolonged N bioavailability by nitrification delayed flowering by converting tryptophan to the phytohormone indole acetic acid (IAA), thus downregulating genes that trigger flowering, and stimulating further plant growth. The addition of IAA to hydroponic cultures confirmed this metabolic network.
Conclusions: We document a novel metabolic network in which soil microbiota influenced plant flowering time, thus shedding light on the key role of soil microbiota on plant functioning. This opens up multiple opportunities for application, from helping to mitigate some of the effects of climate change and environmental stress on plants (e.g. abnormal temperature variation, drought, salinity) to manipulating plant characteristics using microbial inocula to increase crop potential.
Keywords: Arabidopsis; Flowering time; Indole acetic acid; Microbiota; Nitrogen; Rhizosphere; Root exudate.
Conflict of interest statement
Ethics approval and consent to participate
Not applicable.
Consent for publication
Not applicable.
Competing interests
The authors declare that they have no competing interests.
Publisher’s Note
Springer Nature remains neutral with regard to jurisdictional claims in published maps and institutional affiliations.
Figures
Similar articles
-
Lateral root enriched Massilia associated with plant flowering in maize.Microbiome. 2024 Jul 9;12(1):124. doi: 10.1186/s40168-024-01839-4. Microbiome. 2024. PMID: 38982519 Free PMC article.
-
Diurnal cycling of rhizosphere bacterial communities is associated with shifts in carbon metabolism.Microbiome. 2017 Jun 24;5(1):65. doi: 10.1186/s40168-017-0287-1. Microbiome. 2017. PMID: 28646918 Free PMC article.
-
Systematic characterization of plant-associated bacteria that can degrade indole-3-acetic acid.PLoS Biol. 2024 Nov 26;22(11):e3002921. doi: 10.1371/journal.pbio.3002921. eCollection 2024 Nov. PLoS Biol. 2024. PMID: 39591453 Free PMC article.
-
Sphere of influence of indole acetic acid and nitric oxide in bacteria.J Basic Microbiol. 2015 May;55(5):543-53. doi: 10.1002/jobm.201400224. Epub 2014 Jun 10. J Basic Microbiol. 2015. PMID: 24913042 Review.
-
Nitrogen - essential macronutrient and signal controlling flowering time.Physiol Plant. 2018 Feb;162(2):251-260. doi: 10.1111/ppl.12664. Epub 2017 Nov 23. Physiol Plant. 2018. PMID: 29095491 Review.
Cited by
-
Microbiome sustains forest ecosystem functions across hierarchical scales.Eco Environ Health. 2023 Mar 9;2(1):24-31. doi: 10.1016/j.eehl.2023.03.001. eCollection 2023 Mar. Eco Environ Health. 2023. PMID: 38074452 Free PMC article. Review.
-
The legacy of microbial inoculants in agroecosystems and potential for tackling climate change challenges.iScience. 2022 Jan 30;25(3):103821. doi: 10.1016/j.isci.2022.103821. eCollection 2022 Mar 18. iScience. 2022. PMID: 35243218 Free PMC article. Review.
-
Effects of Bacillus subtilis T6-1 on the Rhizosphere Microbial Community Structure of Continuous Cropping Poplar.Biology (Basel). 2022 May 23;11(5):791. doi: 10.3390/biology11050791. Biology (Basel). 2022. PMID: 35625519 Free PMC article.
-
Bacillus velezensis strain B26 modulates the inflorescence and root architecture of Brachypodium distachyon via hormone homeostasis.Sci Rep. 2022 May 13;12(1):7951. doi: 10.1038/s41598-022-12026-6. Sci Rep. 2022. PMID: 35562386 Free PMC article.
-
Analysis of Astragalus Polysaccharide Intervention in Heat-Stressed Dairy Cows' Serum Metabolomics.Animals (Basel). 2020 Mar 29;10(4):574. doi: 10.3390/ani10040574. Animals (Basel). 2020. PMID: 32235382 Free PMC article.
References
-
- Menzel A, Sparks TH, Estrella N, Koch E, Aasa A, Ahas R, et al. European phenological response to climate change matches the warming pattern. Glob Chang Biol. 2006;12:1969–1976. doi: 10.1111/j.1365-2486.2006.01193.x. - DOI
-
- Hinsinger P, Bengough AG, Vetterlein D, Young IM. Rhizosphere: biophysics, biogeochemistry and ecological relevance. Plant Soil. 2009;321:117–152. doi: 10.1007/s11104-008-9885-9. - DOI
Publication types
MeSH terms
Substances
Grants and funding
LinkOut - more resources
Full Text Sources
