

Predictive value of targeted proteomics for coronary plaque morphology in patients with suspected coronary artery disease
- PMID: 30587458
- PMCID: PMC6355456
- DOI: 10.1016/j.ebiom.2018.12.033
Predictive value of targeted proteomics for coronary plaque morphology in patients with suspected coronary artery disease
Abstract
Background: Risk stratification is crucial to improve tailored therapy in patients with suspected coronary artery disease (CAD). This study investigated the ability of targeted proteomics to predict presence of high-risk plaque or absence of coronary atherosclerosis in patients with suspected CAD, defined by coronary computed tomography angiography (CCTA).
Methods: Patients with suspected CAD (n = 203) underwent CCTA. Plasma levels of 358 proteins were used to generate machine learning models for the presence of CCTA-defined high-risk plaques or complete absence of coronary atherosclerosis. Performance was tested against a clinical model containing generally available clinical characteristics and conventional biomarkers.
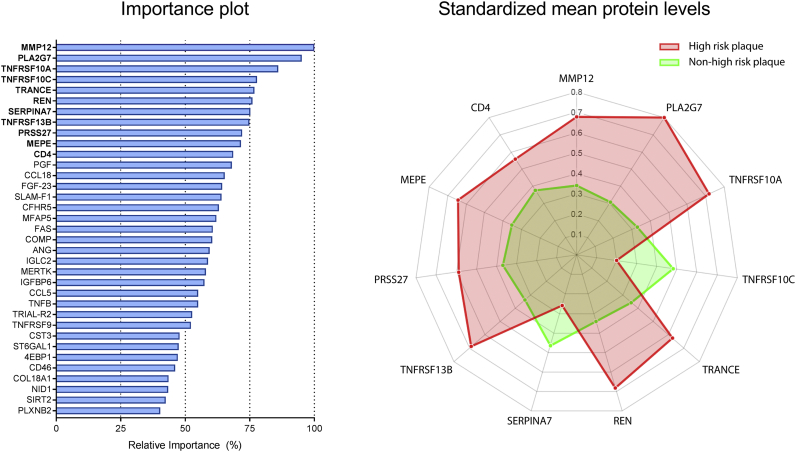
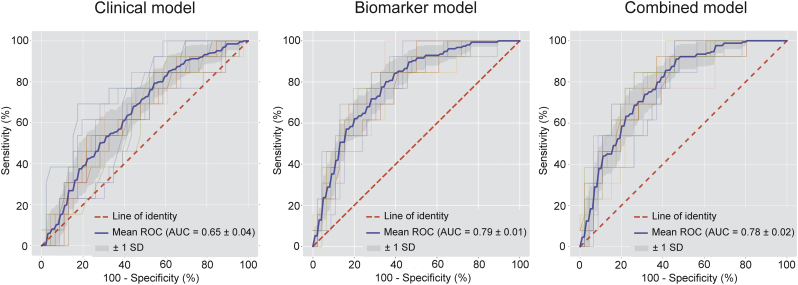
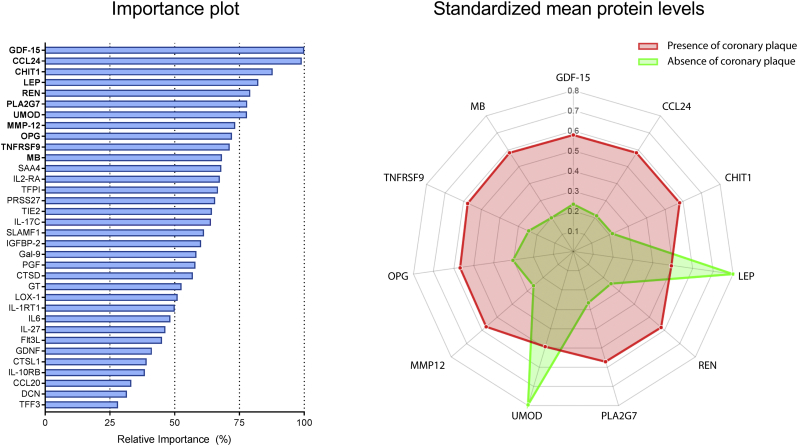
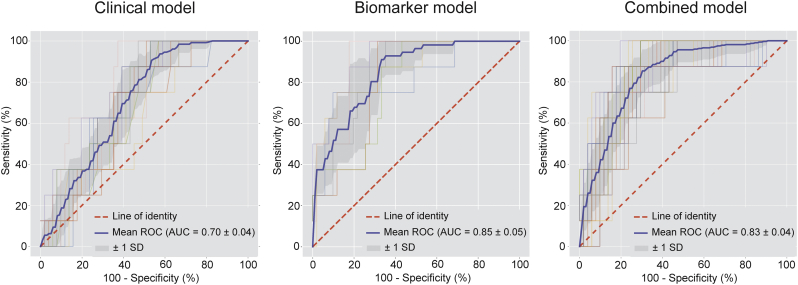
Findings: A total of 196 patients with analyzable protein levels (n = 332) was included for analysis. A subset of 35 proteins was identified predicting the presence of high-risk plaques. The developed machine learning model had fair diagnostic performance with an area under the curve (AUC) of 0·79 ± 0·01, outperforming prediction with generally available clinical characteristics (AUC = 0·65 ± 0·04, p < 0·05). Conversely, a different subset of 34 proteins was predictive for the absence of CAD (AUC = 0·85 ± 0·05), again outperforming prediction with generally available characteristics (AUC = 0·70 ± 0·04, p < 0·05).
Interpretation: Using machine learning models, trained on targeted proteomics, we defined two complementary protein signatures: one for identification of patients with high-risk plaques and one for identification of patients with absence of CAD. Both biomarker subsets were superior to generally available clinical characteristics and conventional biomarkers in predicting presence of high-risk plaque or absence of coronary atherosclerosis. These promising findings warrant external validation of the value of targeted proteomics to identify cardiovascular risk in outcome studies. FUND: This study was supported by an unrestricted research grant from HeartFlow Inc. and partly supported by a European Research Area Network on Cardiovascular Diseases (ERA-CVD) grant (ERA CVD JTC2017, OPERATION). Funders had no influence on trial design, data evaluation, and interpretation.
Keywords: Biomarkers; Coronary artery disease; Coronary computed tomography angiography; Proteomics; Risk assessment.
Copyright © 2018 The Authors. Published by Elsevier B.V. All rights reserved.
Figures
References
-
- Motoyama S., Ito H., Sarai M. Plaque characterization by coronary computed tomography angiography and the likelihood of acute coronary events in mid-term follow-up. J Am Coll Cardiol. 2015;66:337–346. - PubMed
-
- Otsuka K., Fukuda S., Tanaka A. Napkin-ring sign on coronary CT angiography for the prediction of acute coronary syndrome. JACC Cardiovasc Imaging. 2013;6:448–457. - PubMed
-
- Bom M.J., van der Heijden D.J., Kedhi E. Early detection and treatment of the vulnerable coronary plaque: can we prevent acute coronary syndromes? Circ Cardiovasc Imaging. 2017;10 - PubMed
-
- Piepoli M.F., Hoes A.W., Agewall S. European guidelines on cardiovascular disease prevention in clinical practice: the Sixth Joint Task Force of the European Society of Cardiology and Other Societies on Cardiovascular Disease Prevention in Clinical Practice (constituted by representatives of 10 societies and by invited experts)developed with the special contribution of the European Association for Cardiovascular Prevention & Rehabilitation (EACPR) Eur Heart J. 2016;37:2315–2381. - PMC - PubMed
-
- Eichler K., Puhan M.A., Steurer J., Bachmann L.M. Prediction of first coronary events with the Framingham score: a systematic review. Am Heart J. 2007;153:722–731. - PubMed
MeSH terms
Substances
LinkOut - more resources
Full Text Sources
Other Literature Sources
Medical
Miscellaneous
