. 2019 Feb 4;218(2):508-523.
doi: 10.1083/jcb.201801151. Epub 2018 Dec 26.

Autophagic degradation of lamins facilitates the nuclear egress of herpes simplex virus type 1

Affiliations

Autophagic degradation of lamins facilitates the nuclear egress of herpes simplex virus type 1

Aykut Turan et al. J Cell Biol. .

Abstract

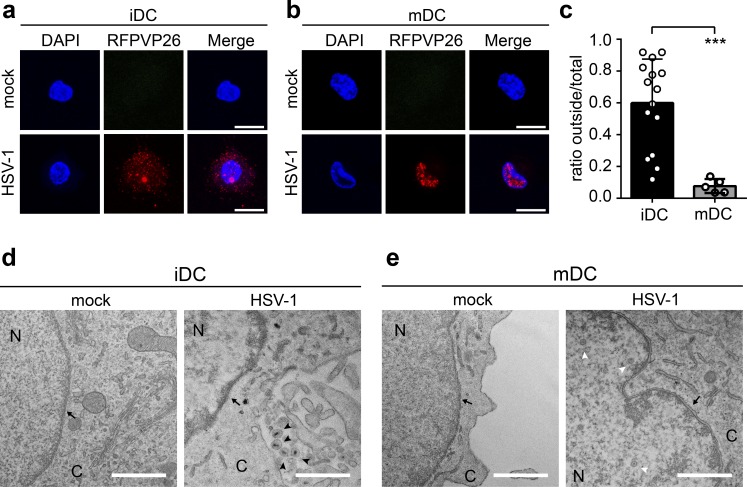
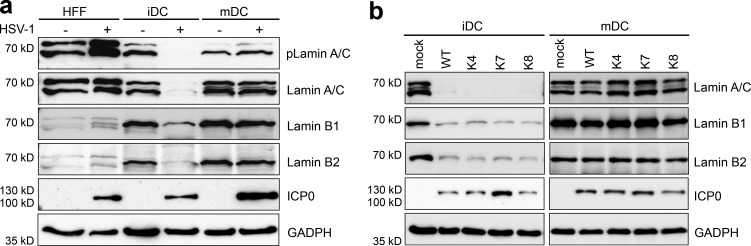
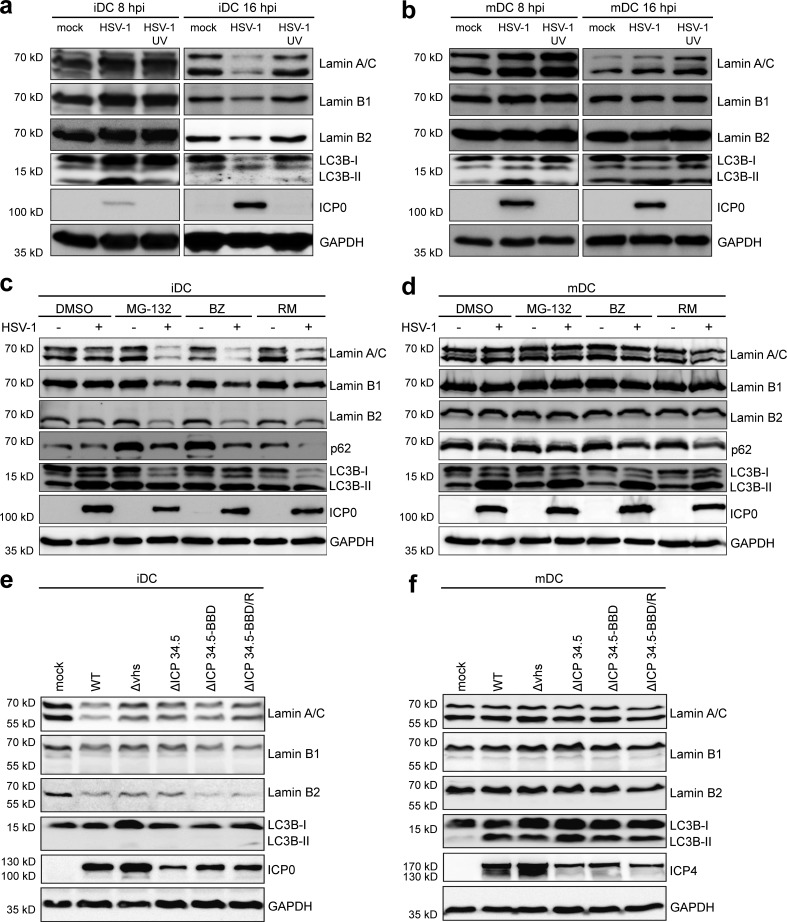
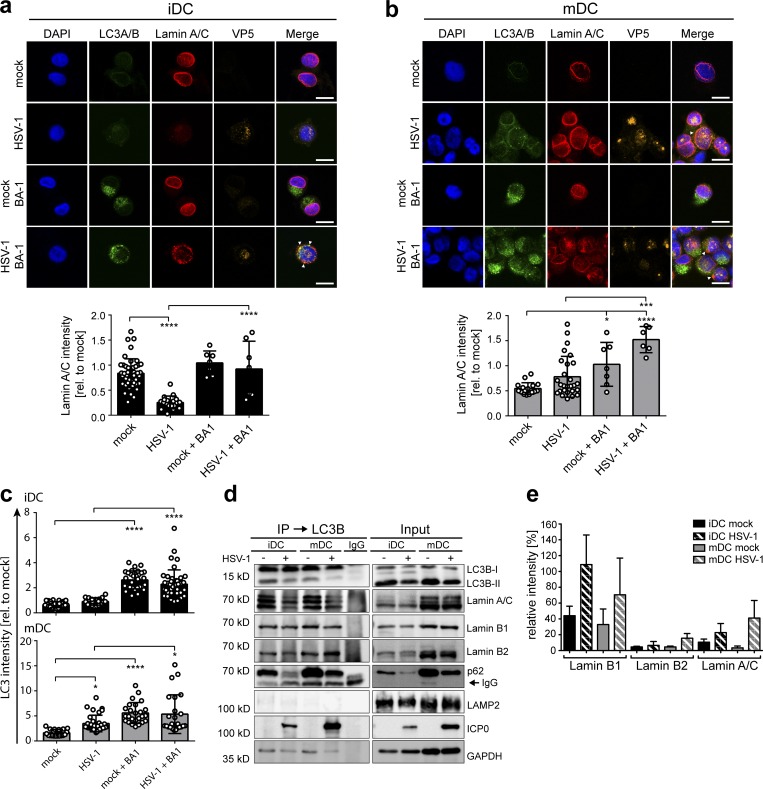
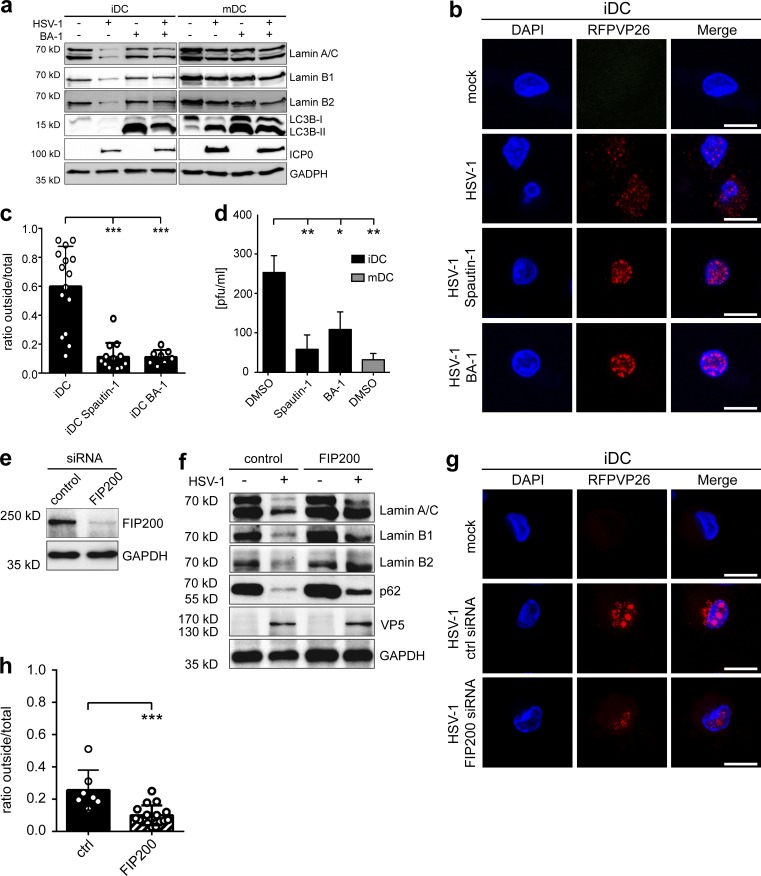
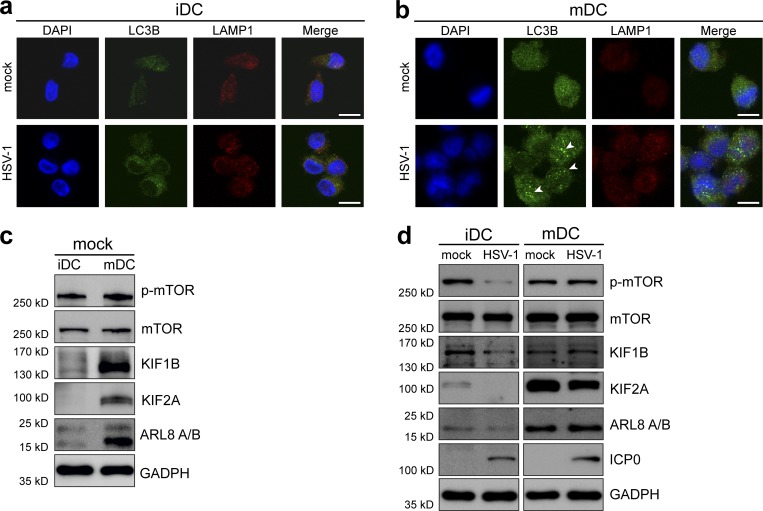
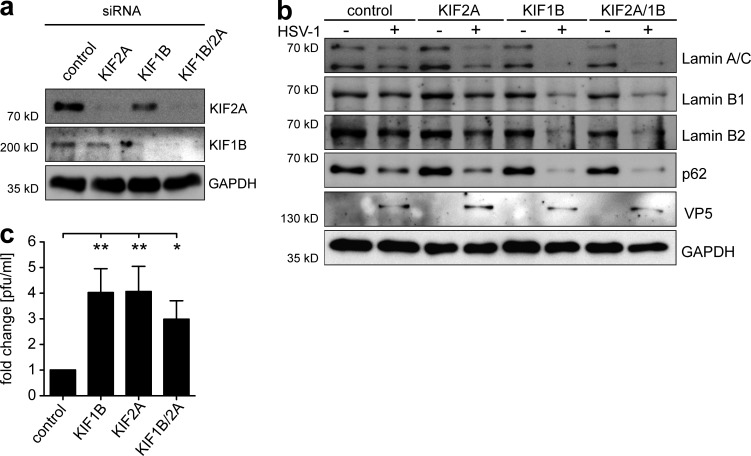
Dendritic cells (DCs) are crucial for the induction of potent antiviral immune responses. In contrast to immature DCs (iDCs), mature DCs (mDCs) are not permissive for infection with herpes simplex virus type 1 (HSV-1). Here, we demonstrate that HSV-1 infection of iDCs and mDCs induces autophagy, which promotes the degradation of lamin A/C, B1, and B2 in iDCs only. This in turn facilitates the nuclear egress of progeny viral capsids and thus the formation of new infectious particles. In contrast, lamin protein levels remain stable in HSV-1-infected mDCs due to an inefficient autophagic flux. Elevated protein levels of KIF1B and KIF2A in mDCs inhibited lamin degradation, likely by hampering autophagosome-lysosome fusion. Therefore, in mDCs, fewer progeny capsids were released from the nuclei into the cytosol, and fewer infectious virions were assembled. We hypothesize that inhibition of autophagic lamin degradation in mDCs represents a very powerful cellular counterstrike to inhibit the production of progeny virus and thus viral spread.


Figures

Figure 1.
Figure 1.
Viral capsids are retained in the nucleus of mDCs, but not iDCs. (a and b) iDCs (a) and mDCs (b) were mock- or HSV1-RFPVP26–infected and cultured on poly-L-lysine–coated coverslips for 24 h. Nuclei were stained using DAPI (blue). Scale bars, 10 µm. (c) Quantification of intranuclear and cytoplasmic capsids in iDCs (black bar, n = 15) versus mDCs (gray bar, n = 5) based on RFPVP26 signals. Values are shown as ratios of integral intensities of cytoplasmic (“outside”) versus total capsid signals. Error bars indicate SD. Significant changes were analyzed using the Mann–Whitney U test and are indicated by asterisks (***, P < 0.001). (d and e) Transmission electron microscopy images of mock- or HSV-1 WT–infected iDCs (d) and mDCs (e). Original magnification 15,000. Scale bars, 1 µm. Black arrows, nuclear membrane; white arrowheads, capsids; black arrowheads, enveloped capsids. C, cytoplasm; N, nucleus.
Figure 2.
Figure 2.
Nuclear lamin protein levels are down-regulated in HSV-1–infected iDCs, but not mDCs. (a) HFF, iDCs, and mDCs (2 × 10⁶) were mock- or HSV1-RFPVP26–infected (MOI of 2) and harvested 24 hpi. Cells were directly lysed and subjected to immunoblot analyses using specific antibodies raised against phospho-lamin A/C (pLamin A/C), lamin A/C, lamin B1, lamin B2, or ICP0. GAPDH was used to verify equal loading. (b) iDCs and mDCs were mock- or HSV-1–infected or infected with HSV-1 clinical isolates (K4, K7, and K8) and harvested 24 hpi. Samples were analyzed for protein expression of lamin A/C, lamin B1, lamin B2, and ICP0. GAPDH was used as a loading control. Experiments were performed at least three times with cells from different healthy donors and representative data are shown.
Figure 3.
Figure 3.
Induction of autophagy leads to an accelerated down-regulation of nuclear lamin protein levels in HSV-1–infected iDCs but not mDCs. (a and b) iDCs (a) and mDCs (b) were mock-, HSV-1–, or HSV-1 UV–infected and harvested 8 or 16 hpi. Samples were analyzed using immunoblotting for detection of lamin A/C, lamin B1, lamin B2, LC3B, or ICP0 levels. GAPDH was used as internal loading control. (c and d) iDCs (c) and mDCs (d) were mock- or HSV-1–infected and treated with different compounds known to induce autophagy (MG-132; BZ, bortezomib; RM, rapamycin) or DMSO as negative control. Cells were harvested 8 hpi, directly lysed, and subjected to immunoblot analyses using specific antibodies against lamin A/C, lamin B1, lamin B2, p62, LC3B, or ICP0. GAPDH was used to verify equal loading. (e and f) iDCs (e) and mDCs (f) were mock-, HSV-1 WT–, HSV-1 Δvhs–, HSV-1 ΔICP34.5–, HSV-1 ΔICP34.5-BBD–, or HSV-1 ΔICP34.5-BBD/R–infected and harvested 16 hpi. Expression levels of lamin A/C, lamin B1, lamin B2, LC3B, or ICP0/ICP4 were analyzed using immunoblot analyses. GAPDH was used as internal loading control. Experiments were performed at least three times with cells from different healthy donors.
Figure 4.
Figure 4.
Nuclear lamins colocalize with autophagosomes in iDCs and mDCs. (a and b) iDCs (a) and mDCs (b) were mock- or HSV-1–infected and treated with or without BA-1. After 24 h of incubation, cells were analyzed via immunofluorescence microscopy for expression of LC3A/B (green), lamin A/C (red), and VP5 (orange). Nuclei were stained using DAPI (blue). Scale bars, 10 µm. Arrowheads display colocalization of LC3A/B and lamin A/C. Lamin A/C immunofluorescence signals were quantified as mean intensities. Values are shown relative to mock signal (i.e., without BA-1; iDC mock, n = 47; iDC HSV-1, n = 25; iDC mock + BA1, n = 7; iDC HSV-1+BA1, n = 7; mDC mock, n = 17; mDC HSV-1, n = 27; mDC mock + BA1, n = 7; mDC HSV-1 + BA1, n = 6). (c) Mean signal intensities of LC3A/B (a and b; and Fig. S4) were quantified in iDCs (top, black bars) and mDCs (bottom, gray bars). Values are shown relative to mock signal of the respective experiment (iDC mock, n = 28; iDC HSV-1, n = 19; iDC mock + BA1, n = 30; iDC HSV-1 + BA1, n = 42; mDC mock, n = 20; mDC HSV-1, n = 34; mDC mock + BA1, n = 25; mDC HSV-1 + BA1, n = 24). Error bars indicate SD. Significant changes were analyzed using a one-way ANOVA and Bonferroni multiple comparison post hoc tests and are indicated by asterisks (*, P < 0.05; ***, P < 0.001; ****, P < 0.0001). (d and e) iDCs and mDCs (8 × 10⁶) were mock- or HSV-1–infected and treated with BA-1. Cells were lysed 16 hpi and used for LC3B-immunoprecipitation. Samples were analyzed using immunoblot for expression of LC3B, lamin A/C, lamin B1, lamin B2, p62, LAMP2, ICP0, or GAPDH (d) and mass spectrometry–based proteomic label-free comparison of lamin A/C, lamin B1, and lamin B2 (e). Experiments were performed three times with cells from different healthy donors.
Figure 5.
Figure 5.
Inhibition of autophagy-mediated lamin degradation prevents nuclear egress of newly built capsids. (a–d) iDCs or mDCs were mock- or HSV-1–infected and treated with BA-1 1 h before infection. Cells were harvested 16 hpi, and samples were subjected to immunoblot analyses using antibodies specific for lamin A/C, lamin B1, lamin B2, LC3B, and ICP0 (a). GAPDH was used as a loading control. iDCs and mDCs were mock or HSV1-RFPVP26 infected and treated with spautin-1, BA-1, or DMSO as negative control (b and c). Cells were analyzed using confocal microscopy (b). Nuclei were stained using DAPI (blue). Scale bars, 10 µm. Quantification of intranuclear and cytoplasmic capsids based on RFPVP26 signals (c). Values are shown as ratios of cytoplasmic (“outside”) versus total capsid signals based on integral intensities (iDC, n = 15, iDC spautin-1, n = 13; iDC BA-1, n = 8). Error bars indicate SD. Significant changes were analyzed using the Mann–Whitney U test. Viral titers of the supernatants of iDCs (black bars) and mDCs (gray bar) were determined using a plaque assay (d). (e–h) IDCs (6 × 10⁶) were electroporated with control or FIP200 siRNA. After 48 h, DCs were used for infection experiments. Cells were subjected to immunoblot analyses of FIP200 and GAPDH as loading control (e). DCs were mock- or HSV-1–infected and analyzed for protein levels of lamin A/C, lamin B1, lamin B2, and p62 using immunoblotting 20 hpi (f). VP5 was used as infection control and GAPDH to verify equal loading. DCs were mock- or HSV1-RFPVP26–infected and analyzed using confocal microscopy at 20 hpi (g and h). Nuclei were stained using DAPI (blue). Scale bars, 10 µm. Quantification of intranuclear and cytoplasmic capsids based on RFPVP26 signals (h). Values are shown as ratios of cytoplasmic (“outside”) versus total capsid signals based on integral intensities (control, n = 8; FIP200, n = 16). Error bars indicate SD. Significant changes were analyzed using the Mann–Whitney U test. Significant changes are indicated by asterisks (*, P < 0.05; **, P < 0.01; ***, P < 0.001). Experiments were performed three times with cells from different healthy donors.
Figure 6.
Figure 6.
Up-regulation of KIF1B and KIF2A during DC maturation inhibits fusion of autophagosomes with lysosomes in mDCs. (a and b) iDCs (a) or mDCs (b) were mock- or HSV-1–infected. Cells were subjected to confocal immunofluorescence microscopy at 8 hpi. DCs were labeled with antibodies specific for LC3B (green) and LAMP1 (red). Nuclei were stained with DAPI (blue). Arrowheads mark autophagosome accumulations. Scale bars, 10 µm. (c) iDCs and mDCs (3 × 10⁶) were subjected to immunoblot analyses. Protein levels of phospho-mTOR, mTOR, KIF1B, KIF2A, and ARL8 A/B were investigated. GAPDH was used as internal loading control. The experiment was performed at least four times with cells from different healthy donors. (d) iDCs and mDCs (3 × 10⁶) were mock- or HSV-1–infected and analyzed using immunoblot at 16 hpi. Levels of phospho-mTOR, mTOR, KIF1B, KIF2A, and ARL8 A/B were detected with the respective antibodies. Infection of DCs was confirmed using ICP0. GAPDH was used to verify equal loading. Experiments were performed at least three times with cells from different healthy donors.
Figure 7.
Figure 7.
RNAi-mediated silencing of KIF1B and KIF2A facilitates lamin degradation and nuclear egress of progeny HSV-1 capsids. IDCs (3 × 10⁶) were electroporated with control siRNA, KIF1B siRNA, KIF2A siRNA or both, KIF1B and KIF2A siRNA. Afterward, maturation was induced via addition of the cytokine cocktail. After 48 h, matured DCs were used for further experiments. (a) Cells were subjected to immunoblot analyses of KIF1B and KIF2A protein levels. GAPDH was used as loading control. (b) DCs were mock- or HSV-1–infected and analyzed for lamin A/C, lamin B1, lamin B2, and p62 levels using immunoblotting 20 hpi. VP5 was used as infection control and GAPDH to verify equal loading. (c) Viral titers of the supernatants were determined using a plaque assay. Error bars indicate SD. Significant changes are indicated by asterisks (*, P < 0.05; **, P < 0.01). The experiment was performed four times with cells from different healthy donors.

Comment in

References

    1. Banchereau J., and Steinman R.M.. 1998. Dendritic cells and the control of immunity. Nature. 392:245–252. 10.1038/32588 - DOI - PubMed
    1. Bjørkøy G., Lamark T., and Johansen T.. 2006. p62/SQSTM1: a missing link between protein aggregates and the autophagy machinery. Autophagy. 2:138–139. 10.4161/auto.2.2.2405 - DOI - PubMed
    1. Bodemann B.O., Orvedahl A., Cheng T., Ram R.R., Ou Y.H., Formstecher E., Maiti M., Hazelett C.C., Wauson E.M., Balakireva M., et al. . 2011. RalB and the exocyst mediate the cellular starvation response by direct activation of autophagosome assembly. Cell. 144:253–267. 10.1016/j.cell.2010.12.018 - DOI - PMC - PubMed
    1. Bolovan C.A., Sawtell N.M., and Thompson R.L.. 1994. ICP34.5 mutants of herpes simplex virus type 1 strain 17syn+ are attenuated for neurovirulence in mice and for replication in confluent primary mouse embryo cell cultures. J. Virol. 68:48–55. - PMC - PubMed
    1. Budida R., Stankov M.V., Döhner K., Buch A., Panayotova-Dimitrova D., Tappe K.A., Pohlmann A., Sodeik B., and Behrens G.M.N.. 2017. Herpes simplex virus 1 interferes with autophagy of murine dendritic cells and impairs their ability to stimulate CD8+ T lymphocytes. Eur. J. Immunol. 47:1819–1834. 10.1002/eji.201646908 - DOI - PubMed

Publication types

Associated data

LinkOut - more resources