. 2019 May 1;25(9):2755-2768.
doi: 10.1158/1078-0432.CCR-18-3230. Epub 2018 Dec 26.

Epigenetic Silencing of miRNA-338-5p and miRNA-421 Drives SPINK1-Positive Prostate Cancer

Affiliations

Epigenetic Silencing of miRNA-338-5p and miRNA-421 Drives SPINK1-Positive Prostate Cancer

Vipul Bhatia et al. Clin Cancer Res. .

Abstract

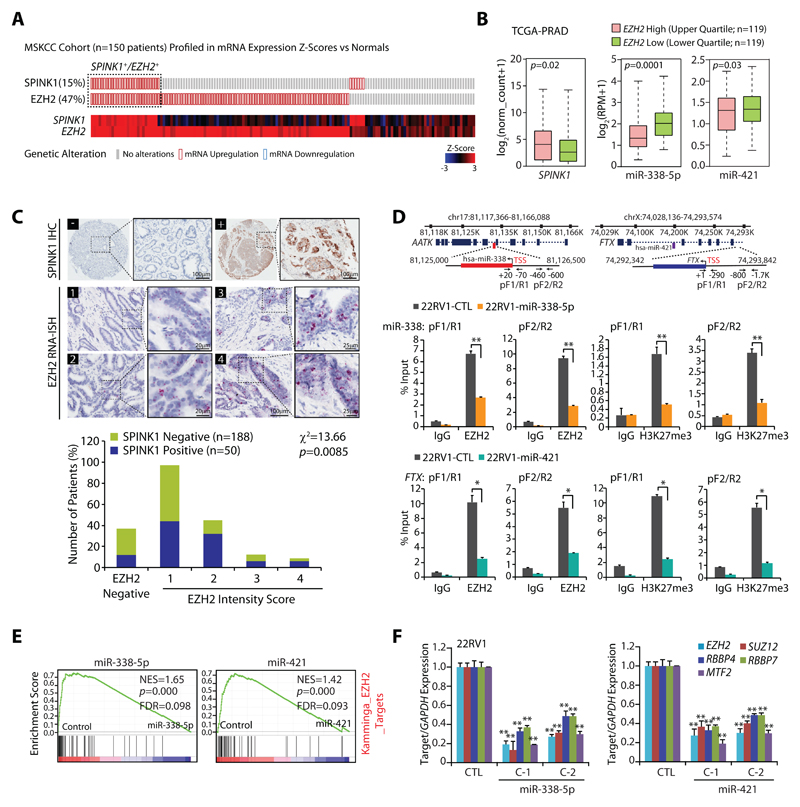
Purpose: Serine peptidase inhibitor, Kazal type-1 (SPINK1) overexpression defines the second most recurrent and aggressive prostate cancer subtype. However, the underlying molecular mechanism and pathobiology of SPINK1 in prostate cancer remains largely unknown.

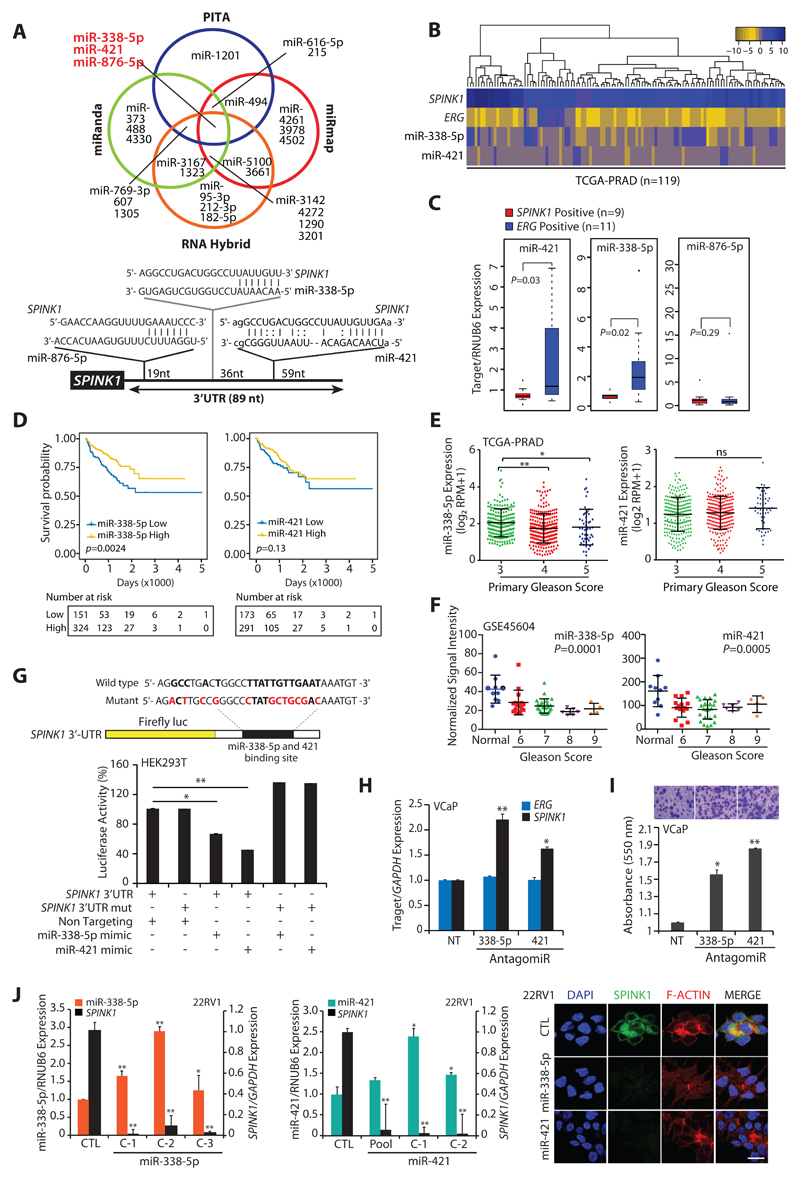
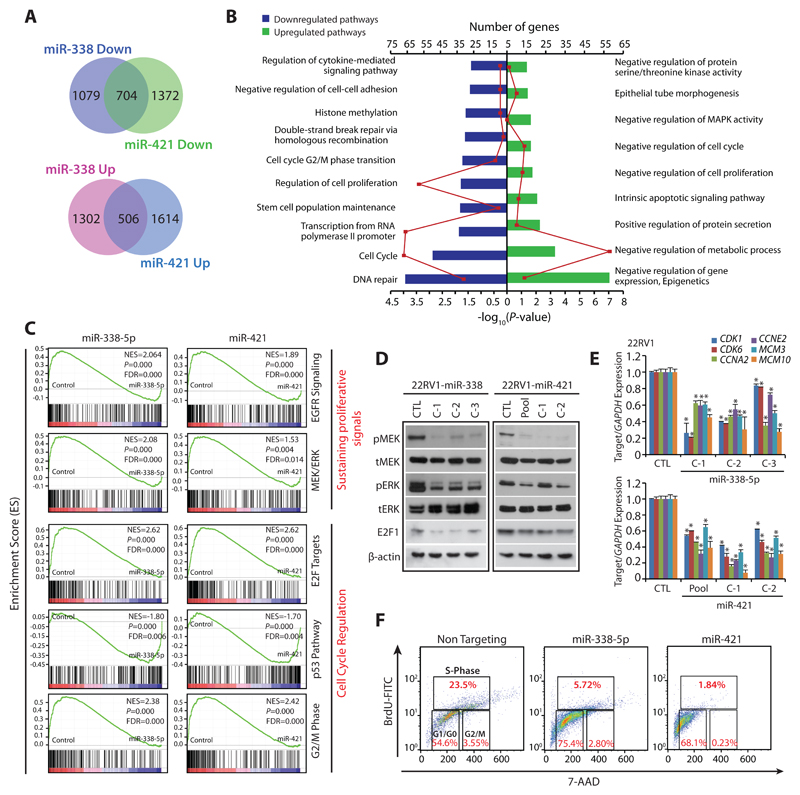
Experimental design: miRNA prediction tools were employed to examine the SPINK1-3'UTR for miRNA binding. Luciferase reporter assays were performed to confirm the SPINK1-3'UTR binding of shortlisted miR-338-5p/miR-421. Furthermore, miR-338-5p/-421-overexpressing cancer cells (SPINK1-positive) were evaluated for oncogenic properties using cell-based functional assays and a mouse xenograft model. Global gene expression profiling was performed to unravel the biological pathways altered by miR-338-5p/-421. IHC and RNA in situ hybridization were carried out on prostate cancer patients' tissue microarray for SPINK1 and EZH2 expression, respectively. Chromatin immunoprecipitation assay was performed to examine EZH2 occupancy on the miR-338-5p/-421-regulatory regions. Bisulfite sequencing and methylated DNA immunoprecipitation were performed on prostate cancer cell lines and patients' specimens.

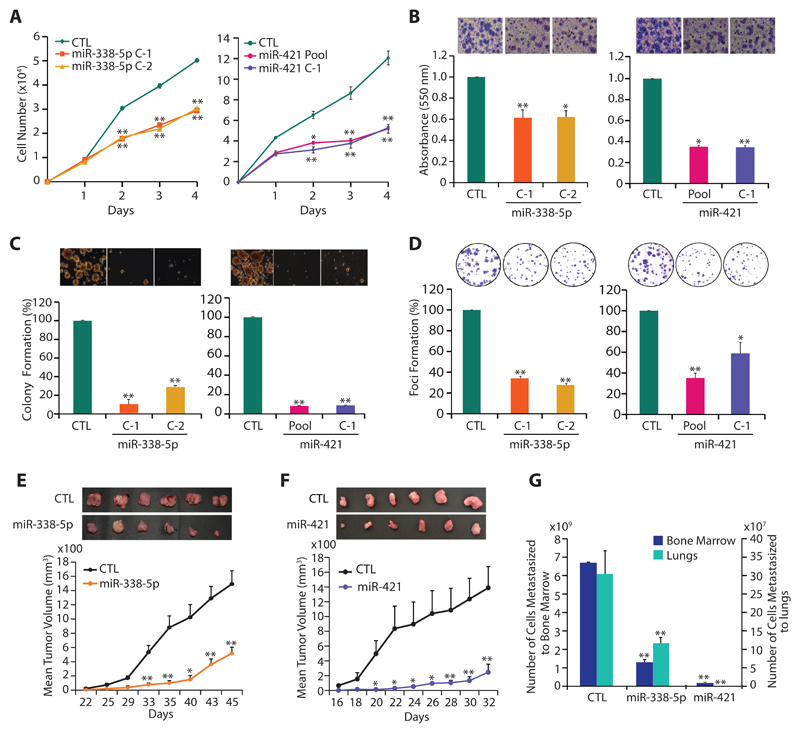
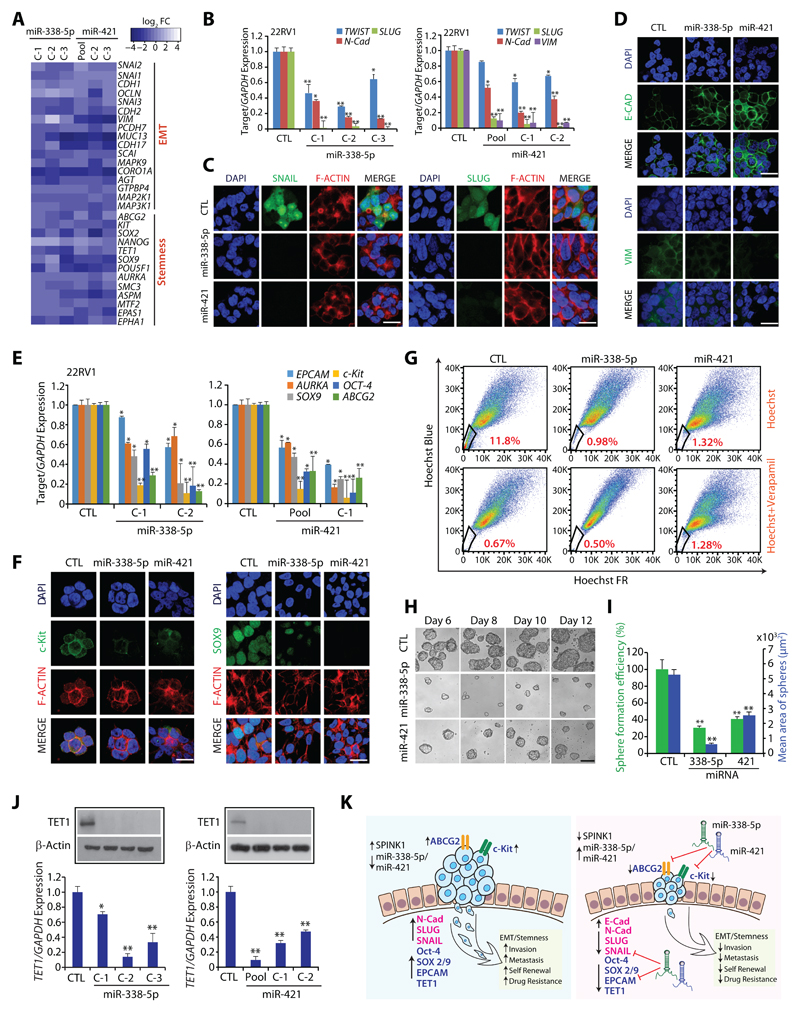
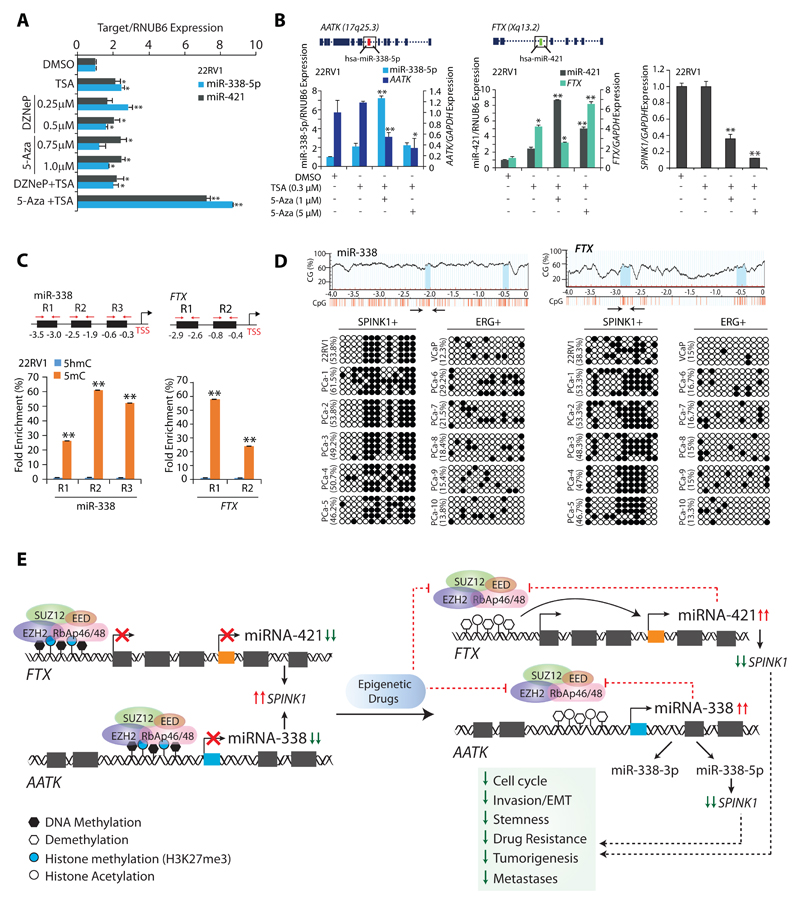
Results: We established a critical role of miRNA-338-5p/-421 in posttranscriptional regulation of SPINK1. Ectopic expression of miRNA-338-5p/-421 in SPINK1-positive cells abrogates oncogenic properties including cell-cycle progression, stemness, and drug resistance, and shows reduced tumor burden and distant metastases in a mouse model. Importantly, we show that patients with SPINK1-positive prostate cancer exhibit increased EZH2 expression, suggesting its role in epigenetic silencing of miRNA-338-5p/-421. Furthermore, presence of CpG dinucleotide DNA methylation marks on the regulatory regions of miR-338-5p/-421 in SPINK1-positive prostate cancer cells and patients' specimens confirms epigenetic silencing.

Conclusions: Our findings revealed that miRNA-338-5p/-421 are epigenetically silenced in SPINK1-positive prostate cancer, although restoring the expression of these miRNAs using epigenetic drugs or synthetic mimics could abrogate SPINK1-mediated oncogenesis.See related commentary by Bjartell, p. 2679.


Conflict of interest statement

Conflict of interest: The authors declare no conflicts of interest or disclosures.

Figures

Figure 1
Figure 1. MiR-338-5p and miR-421 are differentially expressed in SPINK1+/ERG-fusion-negative prostate cancer
(A) Venn diagram displaying miRNAs computationally predicted to target SPINK1 by PITA, miRmap, miRanda and RNAHybrid (top panel). Schematic of predicted miR-338-5p, miR-421 and miR-876-5p binding sites on the 3′-UTR of SPINK1 (bottom panel). (B) Heatmap depicting miR-338-5p and miR-421 expression in the SPINK1+/ERG-negative patients’ (n=119) in TCGA-PRAD dataset. Shades of blue and golden represents log2 (x+1), where x represents the gene expression value. (C) Taqman assay showing relative expression for miR-338-5p, miR-421 and miR-876-5p in SPINK1+ and ERG+ PCa patients’ specimens (n=20). Data represents normalized expression values with respect to RNUB6 control. Error bars represent mean ± SEM. P-values were calculated using two-tailed unpaired Student's t test. (D) Kaplan-Meier curve showing survival probability in TCGA-PRAD cohort stratified based on high versus low miR-338-5p and miR-421expression (n=475 and n=465 respectively). (E) RNA-Seq data from TCGA-PRAD cohort showing expression of miR-338-5p (n=475) and miR-421 (n=465) in PCa patients categorized by varying primary Gleason Score. (F) Expression of miR-338-5p and miR-421 in PCa patients (normal=10, PCa =50) categorized by Gleason grades (from GSE45604 dataset). (G) Schematic of luciferase reporter construct with the wild-type or mutated (altered residues in red) SPINK1 3’ untranslated region (3’UTR) downstream of the Firefly luciferase reporter gene (top panel). Luciferase reporter activity in HEK293T cells co-transfected with wild-type or mutant 3′-UTR SPINK1 constructs with mimics for miR-338-5p or miR-421. (H) QPCR data showing SPINK1 and ERG expression in VCaP cells transfected with antagomiRs as indicated (n=3 biologically independent samples; data represent mean ± SEM). (I) Boyden chamber Matrigel invasion assay using same cells as in (E). Representative fields of the invaded cells are shown in the inset. (J) QPCR analysis demonstrating SPINK1 and miRNAs expression in stable 22RV1-miR-338-5p (left panel) and 22RV1-miR-421 cells (middle panel) (n=3 biologically independent samples; data represent mean ± SEM). Immunostaining for SPINK1 (right panel). Scale bar represents 20µm. Statistical significance was calculated by one-way ANOVA with Tukey’s post hoc test for multiple comparisons in the pane E and F. For all other panels *P ≤ 0.05 and **P ≤ 0.005 using two-tailed unpaired Student's t test.
Figure 2
Figure 2. MiR-338-5p and miR-421 abrogates oncogenic properties of SPINK1-positive prostate cancer cells.
(A) Cell proliferation assay using 22RV1-miR-338-5p, 22RV1-miR-421 and 22RV1-CTL cells at the indicated time points. (B) Boyden chamber Matrigel invasion assay using same cells as in (A). Representative fields with invaded cells are shown in the inset (n=3 biologically independent samples; data represent mean ± SEM). (C) Soft agar assay for anchorage-independent growth using same cells as in (A). Representative soft agar colonies are shown in the inset (n=3 biologically independent samples; data represent mean ± SEM). (D) Foci formation assay using same cells as in (A). Representative images depicting foci are shown in the inset (n=3 biologically independent samples; data represent mean ± SEM). (E) Mean tumor growth in NOD/SCID mice (n=8) subcutaneously implanted with stable 22RV1-miR-338-5p and 22RV1-CTL cells. (F) Same as (E), except stable 22RV1-miR-421 cells were implanted. (G) Same as (E and F), except genomic DNA extracted from the lung and bone marrow of the xenografted mice. Data represent mean ± SEM. *P≤ 0.05 and **P≤ 0.005 using two-tailed unpaired Student's t test.
Figure 3
Figure 3. MiR-338-5p and miR-421 overexpression suppress oncogenic pathways and triggers G1/S arrest.
(A) Gene expression profiling data showing overlap of downregulated (upper panel) and upregulated genes (lower panel) in stable 22RV1-miR-338-5p and 22RV1-miR-421 cells relative to 22RV1-CTL cells (n=3 biologically independent samples). (B) Same as in (A), except DAVID analysis showing various downregulated (left) and upregulated (right) pathways. Bars represent –log10 (P-values) and frequency polygon (line in red) represents the number of genes. (C) Gene Set Enrichment Analysis (GSEA) plots showing various deregulated oncogenic gene signatures with the corresponding statistical metrics in the same cells as in (A). (D) Western blot analysis for phosphor (p) and total (t) MEK1/2, ERK1/2 and cell-cycle regulator E2F1 levels. β-actin was used as a loading control. (E) QPCR analysis showing expression of cell-cycle regulators for G1 and S phase as indicated. Expression level for each gene was normalized to GAPDH. (F) BrdU/7-AAD cell-cycle analysis for S-phase arrest in 22RV1 cells transfected with miR-338-5p or miR-421 mimics relative to control cells. In the panels (D), (E) and (F) biologically independent samples were used (n=3); data represents mean ± SEM *P≤ 0.05 and **P≤ 0.005 using two-tailed unpaired Student's t test.
Figure 4
Figure 4. MiR-338-5p and miR-421 overexpression attenuates EMT and Stemness.
(A) Heatmap depicting change in the expression of EMT and pluripotency markers in 22RV1-miR-338-5p and 22RV1-miR-421 cells. Shades of blue represents log2 fold-change in gene expression (n=3 biologically independent samples). (B) QPCR analysis depicts expression of EMT markers in 22RV1-miR-338-5p, 22RV1-miR-421 and control cells. Expression for each gene was normalized to GAPDH. (C) Immunostaining showing SLUG and SNAIL expression in the same cells as in (B). (D) Same cells as in (B), except immunostained for E-cadherin and Vimentin. (E) Same cells as in (B), except qPCR analysis for stem cell markers. (F) Same cells as in (B), except immunostained for c-Kit and SOX-9. (G) Hoechst 33342 staining for side population (SP) analysis using same cells as in (B). Percentages of SP were analyzed using the blue and far red filters, gated regions as indicated (red) in each panel. (H) Phase contrast microscope images for the prostatospheres using same cells as in (B). Scale bar 100μm. (I) Bar plot depicts percent sphere formation efficiency and mean area of the prostatosphere. (J) Expression of TET1 by qPCR and Western blot using same cells as in (B). (K) Schematic describing the role of miR-338-5p and miR-421 in regulating EMT, cancer stemness and drug resistance in SPINK1+ cancer. For panels (C), (D) and (F), scale bar represents 20µm. In the panels (B), (E), (I) and (J) biologically independent samples were used (n=3); data represents mean ± SEM *P≤ 0.05 and **P≤ 0.005 using two-tailed unpaired Student's t test.
Figure 5
Figure 5. Epigenetic silencing of miR-338-5p and miR-421 via EZH2 in SPINK1 positive prostate cancer.
(A) OncoPrint depicting mRNA upregulation of EZH2 and SPINK1 in MSKCC cohort using cBioportal. In the lower panel shades of blue and red represents Z-score normalized expression for EZH2 and SPINK1. (B) Box plot depicting SPINK1, miR-338-5p and miR-421 expression in EZH2 high (n=119) and EZH2 low (n=119) in PCa patients from TCGA-PRAD cohort (C) Representative micrographs depicting PCa tissue microarray (TMA) cores (n=238) stained for SPINK1 by immunohistochemistry (IHC) and EZH2 by RNA in-situ hybridization (RNA-ISH). Top panel represents SPINK1 IHC in SPINK1 negative (–) and SPINK1 positive (+) patients. RNA-ISH intensity score for EZH2 expression was assigned on a scale of 0 to 4 according to visual criteria for the presence of transcript at 40X magnification. Bar plot show EZH2 expression in the SPINK1-negative and SPINK1+ patient specimens. P-value for Chi-square test is indicated. (D) Genomic location for EZH2 binding sites on the miR-338 and FTX promoters and location of ChIP primers (top panel). ChIP-qPCR data showing EZH2 occupancy and H3K27me3 marks on the miR-338, FTX promoters, and MYT1 used as positive control in stable 22RV1-miR-338-5p, 22RV1-miR-421 and 22RV1-CTL cells. (E) GSEA plots showing the enrichment of EZH2 interacting partners (Kamminga) in 22RV1-miR-338-5p and 22RV1-miR-421 cells. (F) QPCR data showing expression of EZH2 and its interacting partners in the same cells as indicated. Biologically independent samples (n=3) were used in panels (D) and (F); data represent mean ± SEM. *P≤ 0.05 and **P≤ 0.005 using two-tailed unpaired Student's t test.
Figure 6
Figure 6. Epigenetic drugs ablate EZH2-mediated silencing of the miR-338-5p and miR-421.
(A) TaqMan assay for miR-338-5p and miR-421 expression in 22RV1 cells treated with different combination of epigenetic drugs. (B) QPCR showing relative expression of miR-338-5p, miR-421, AATK, FTX and SPINK1 in 22RV1 cells treated with 5-Aza or TSA as indicated. (C) MeDIP-qPCR showing fold enrichment of 5-mC over 5-hmC in 22RV1 cells as indicated. (D) Bisulfite–sequencing showing CpG methylation marks on the region upstream of miR-338-5p (left) and FTX (right) in 22RV1, VCaP cells and patients’ tumor specimens (PCa-1 to 5 are SPINK1 positive and PCa-6 to 10 are ERG fusion positive). PCR amplified regions are denoted by arrows. Data represents DNA sequence obtained from five independent clones. Hollow circles represent non-methylated CpG dinucleotides, whereas black solid circles show methylated-CpG sites. (E) Illustration depicting the molecular mechanism involved in EZH2-mediated epigenetic silencing of miR-338-5p and miR-421 in SPINK1-positive prostate cancer. In panels (A), (B) and (C) biologically independent samples (n=3) were used; data represent mean ± SEM. *P≤ 0.05 and **P≤ 0.005 using two-tailed unpaired Student's t test.

Comment in

References

    1. Abeshouse A, Ahn J, Akbani R, Ally A, Amin S, Andry CD, et al. The molecular taxonomy of primary prostate cancer. Cell. 2015;163(4):1011–25. - PMC - PubMed
    1. Palanisamy N, Ateeq B, Kalyana-Sundaram S, Pflueger D, Ramnarayanan K, Shankar S, et al. Rearrangements of the RAF kinase pathway in prostate cancer, gastric cancer and melanoma. Nature medicine. 2010;16(7):793. - PMC - PubMed
    1. Tomlins SA, Rhodes DR, Perner S, Dhanasekaran SM, Mehra R, Sun X-W, et al. Recurrent fusion of TMPRSS2 and ETS transcription factor genes in prostate cancer. science. 2005;310(5748):644–8. - PubMed
    1. Ateeq B, Kunju LP, Carskadon SL, Pandey SK, Singh G, Pradeep I, et al. Molecular profiling of ETS and non-ETS aberrations in prostate cancer patients from northern India. The Prostate. 2015;75(10):1051–62. - PMC - PubMed
    1. Brenner JC, Ateeq B, Li Y, Yocum AK, Cao Q, Asangani IA, et al. Mechanistic rationale for inhibition of poly (ADP-ribose) polymerase in ETS gene fusion-positive prostate cancer. Cancer cell. 2011;19(5):664–78. - PMC - PubMed