

Differential control of human Treg and effector T cells in tumor immunity by Fc-engineered anti-CTLA-4 antibody
- PMID: 30587582
- PMCID: PMC6329979
- DOI: 10.1073/pnas.1812186116
Differential control of human Treg and effector T cells in tumor immunity by Fc-engineered anti-CTLA-4 antibody
Abstract
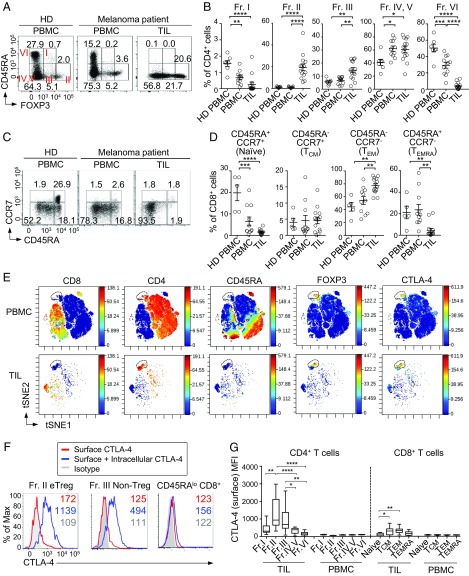
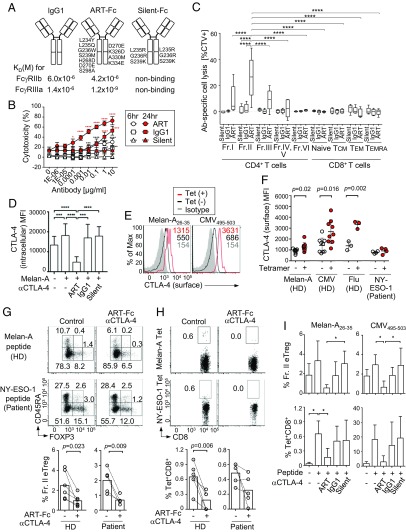
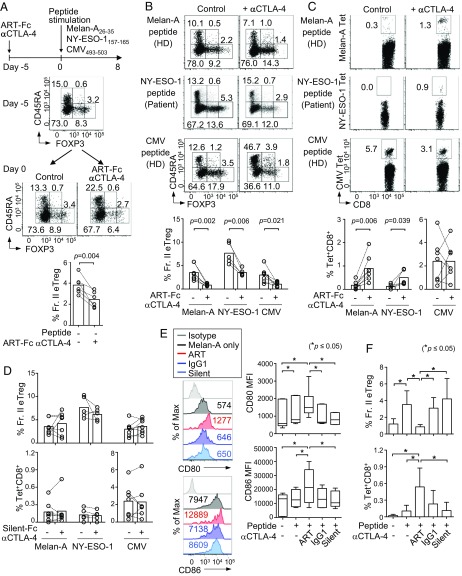
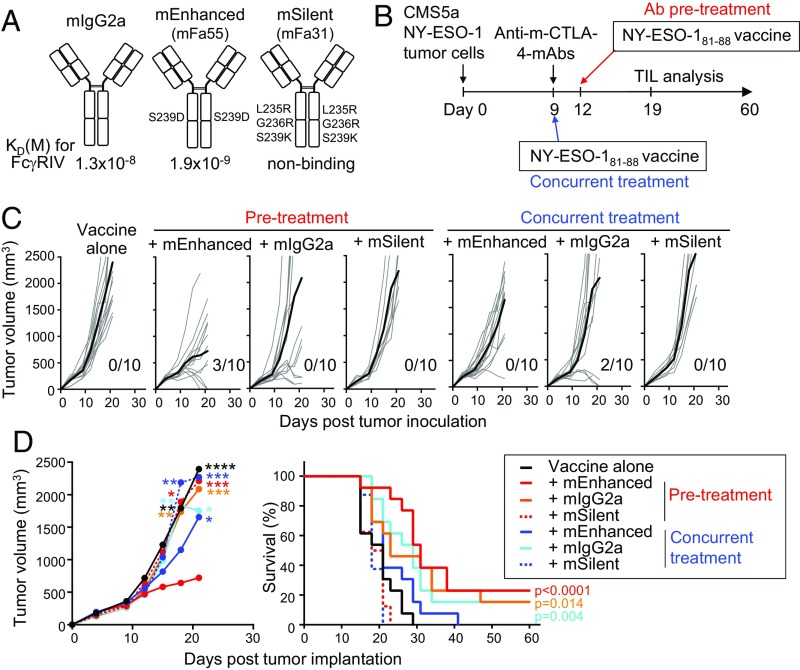
Anti-CTLA-4 mAb is efficacious in enhancing tumor immunity in humans. CTLA-4 is expressed by conventional T cells upon activation and by naturally occurring FOXP3+CD4+ Treg cells constitutively, raising a question of how anti-CTLA-4 mAb can differentially control these functionally opposing T cell populations in tumor immunity. Here we show that FOXP3high potently suppressive effector Treg cells were abundant in melanoma tissues, expressing CTLA-4 at higher levels than tumor-infiltrating CD8+ T cells. Upon in vitro tumor-antigen stimulation of peripheral blood mononuclear cells from healthy individuals or melanoma patients, Fc-region-modified anti-CTLA-4 mAb with high antibody-dependent cell-mediated cytotoxicity (ADCC) and cellular phagocytosis (ADCP) activity selectively depleted CTLA-4+FOXP3+ Treg cells and consequently expanded tumor-antigen-specific CD8+T cells. Importantly, the expansion occurred only when antigen stimulation was delayed several days from the antibody treatment to spare CTLA-4+ activated effector CD8+T cells from mAb-mediated killing. Similarly, in tumor-bearing mice, high-ADCC/ADCP anti-CTLA-4 mAb treatment with delayed tumor-antigen vaccination significantly prolonged their survival and markedly elevated cytokine production by tumor-infiltrating CD8+ T cells, whereas antibody treatment concurrent with vaccination did not. Anti-CTLA-4 mAb modified to exhibit a lesser or no Fc-binding activity failed to show such timing-dependent in vitro and in vivo immune enhancement. Thus, high ADCC anti-CTLA-4 mAb is able to selectively deplete effector Treg cells and evoke tumor immunity depending on the CTLA-4-expressing status of effector CD8+ T cells. These findings are instrumental in designing cancer immunotherapy with mAbs targeting the molecules commonly expressed by FOXP3+ Treg cells and tumor-reactive effector T cells.
Keywords: CTLA-4; FOXP3; antibody-dependent cell-mediated cytotoxicity; cancer immunotherapy; regulatory T cells.
Conflict of interest statement
Conflict of interest statement: H.N. received a research grant from Bristol Myers Squibb. S.S. received a research grant from Chugai Pharmaceutical Co., Ltd. T.K. is employed by Chugai Pharmaceutical Co., Ltd. which provided some of the antibodies used in this study.
Figures
Similar articles
-
Dual blockade of PD-1 and CTLA-4 combined with tumor vaccine effectively restores T-cell rejection function in tumors.Cancer Res. 2013 Jun 15;73(12):3591-603. doi: 10.1158/0008-5472.CAN-12-4100. Epub 2013 Apr 30. Cancer Res. 2013. PMID: 23633484 Free PMC article.
-
A reappraisal of CTLA-4 checkpoint blockade in cancer immunotherapy.Cell Res. 2018 Apr;28(4):416-432. doi: 10.1038/s41422-018-0011-0. Epub 2018 Feb 22. Cell Res. 2018. PMID: 29472691 Free PMC article.
-
Poxvirus-based active immunotherapy synergizes with CTLA-4 blockade to increase survival in a murine tumor model by improving the magnitude and quality of cytotoxic T cells.Cancer Immunol Immunother. 2016 May;65(5):537-49. doi: 10.1007/s00262-016-1816-7. Epub 2016 Mar 10. Cancer Immunol Immunother. 2016. PMID: 26961085 Free PMC article.
-
Regulatory T cells in cancer immunotherapy.Cell Res. 2017 Jan;27(1):109-118. doi: 10.1038/cr.2016.151. Epub 2016 Dec 20. Cell Res. 2017. PMID: 27995907 Free PMC article. Review.
-
Regulatory T cells in cancer immunotherapy.Curr Opin Immunol. 2014 Apr;27:1-7. doi: 10.1016/j.coi.2013.12.005. Epub 2014 Jan 14. Curr Opin Immunol. 2014. PMID: 24413387 Review.
Cited by
-
Newly developed humanized anti-CKAP4 antibody suppresses pancreatic cancer growth by inhibiting DKK1-CKAP4 signaling.Cancer Sci. 2024 Oct;115(10):3358-3369. doi: 10.1111/cas.16278. Epub 2024 Aug 8. Cancer Sci. 2024. PMID: 39118263 Free PMC article.
-
A Peptide-Based PD1 Antagonist Enhances T-Cell Priming and Efficacy of a Prophylactic Malaria Vaccine and Promotes Survival in a Lethal Malaria Model.Front Immunol. 2020 Jul 9;11:1377. doi: 10.3389/fimmu.2020.01377. eCollection 2020. Front Immunol. 2020. PMID: 32733457 Free PMC article.
-
Durvalumab Plus Tremelimumab: A Novel Combination Immunotherapy for Unresectable Hepatocellular Carcinoma.Liver Cancer. 2022 Feb 18;11(2):87-93. doi: 10.1159/000523702. eCollection 2022 Apr. Liver Cancer. 2022. PMID: 35634425 Free PMC article. No abstract available.
-
Effect of Cytotoxic T-Lymphocyte Antigen-4 on the Efficacy of the Fatty Acid-Binding Protein Vaccine Against Schistosoma japonicum.Front Immunol. 2019 May 7;10:1022. doi: 10.3389/fimmu.2019.01022. eCollection 2019. Front Immunol. 2019. PMID: 31134084 Free PMC article.
-
Both intratumoral regulatory T cell depletion and CTLA-4 antagonism are required for maximum efficacy of anti-CTLA-4 antibodies.Proc Natl Acad Sci U S A. 2023 Aug;120(31):e2300895120. doi: 10.1073/pnas.2300895120. Epub 2023 Jul 24. Proc Natl Acad Sci U S A. 2023. PMID: 37487077 Free PMC article.
References
-
- Sakaguchi S. Naturally arising CD4+ regulatory T cells for immunologic self-tolerance and negative control of immune responses. Annu Rev Immunol. 2004;22:531–562. - PubMed
-
- Zou W. Regulatory T cells, tumour immunity and immunotherapy. Nat Rev Immunol. 2006;6:295–307. - PubMed
-
- Shimizu J, Yamazaki S, Sakaguchi S. Induction of tumor immunity by removing CD25+CD4+ T cells: A common basis between tumor immunity and autoimmunity. J Immunol. 1999;163:5211–5218. - PubMed
Publication types
MeSH terms
Substances
LinkOut - more resources
Full Text Sources
Other Literature Sources
Research Materials
