Clinical Trial
. 2019 Jan 8;116(2):660-669.
doi: 10.1073/pnas.1815321116. Epub 2018 Dec 26.

Modular reconfiguration of an auditory control brain network supports adaptive listening behavior

Affiliations
Clinical Trial

Modular reconfiguration of an auditory control brain network supports adaptive listening behavior

Mohsen Alavash et al. Proc Natl Acad Sci U S A. .

Abstract

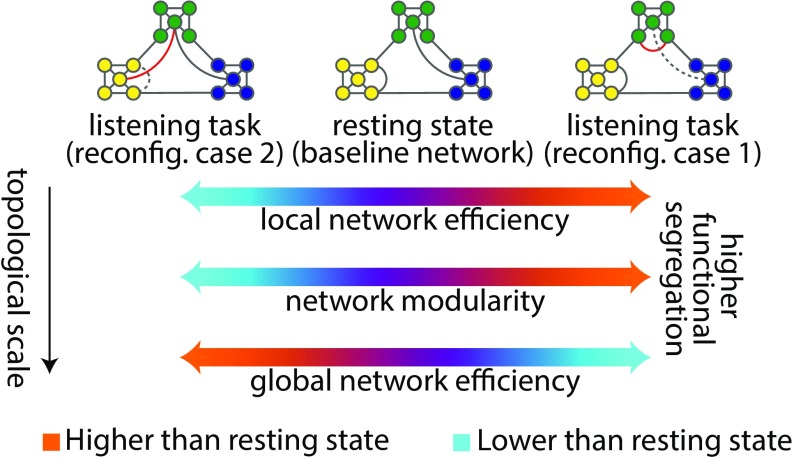
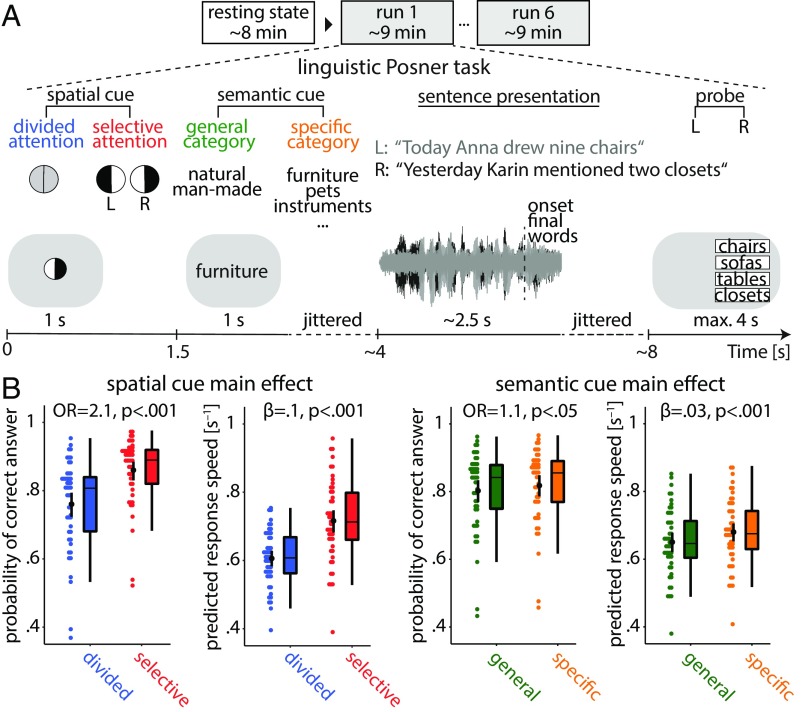
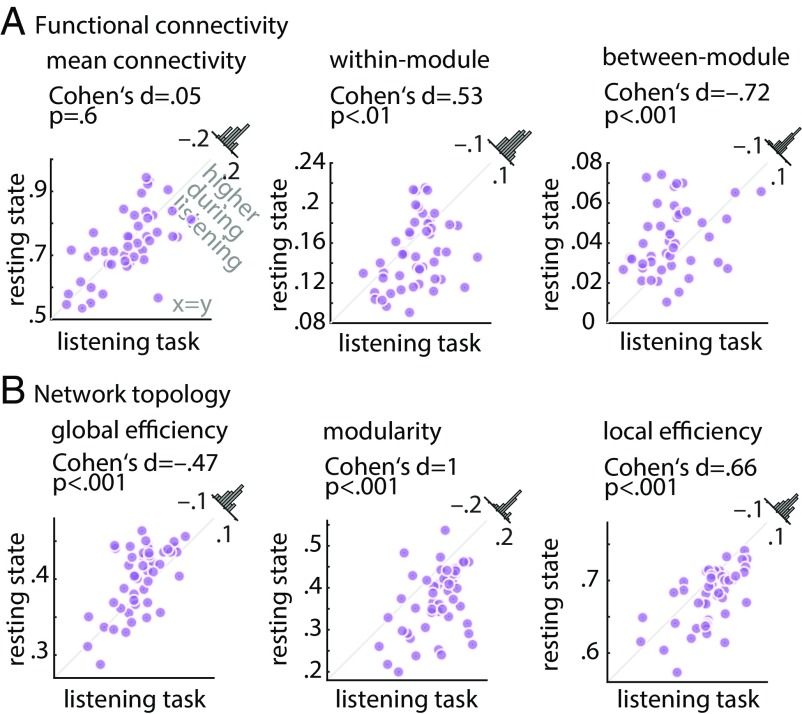
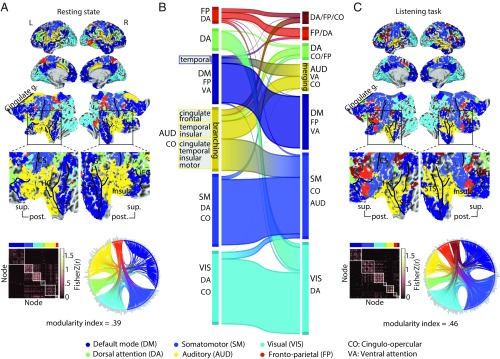
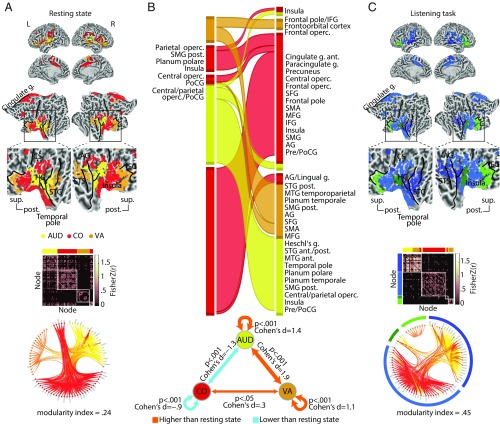
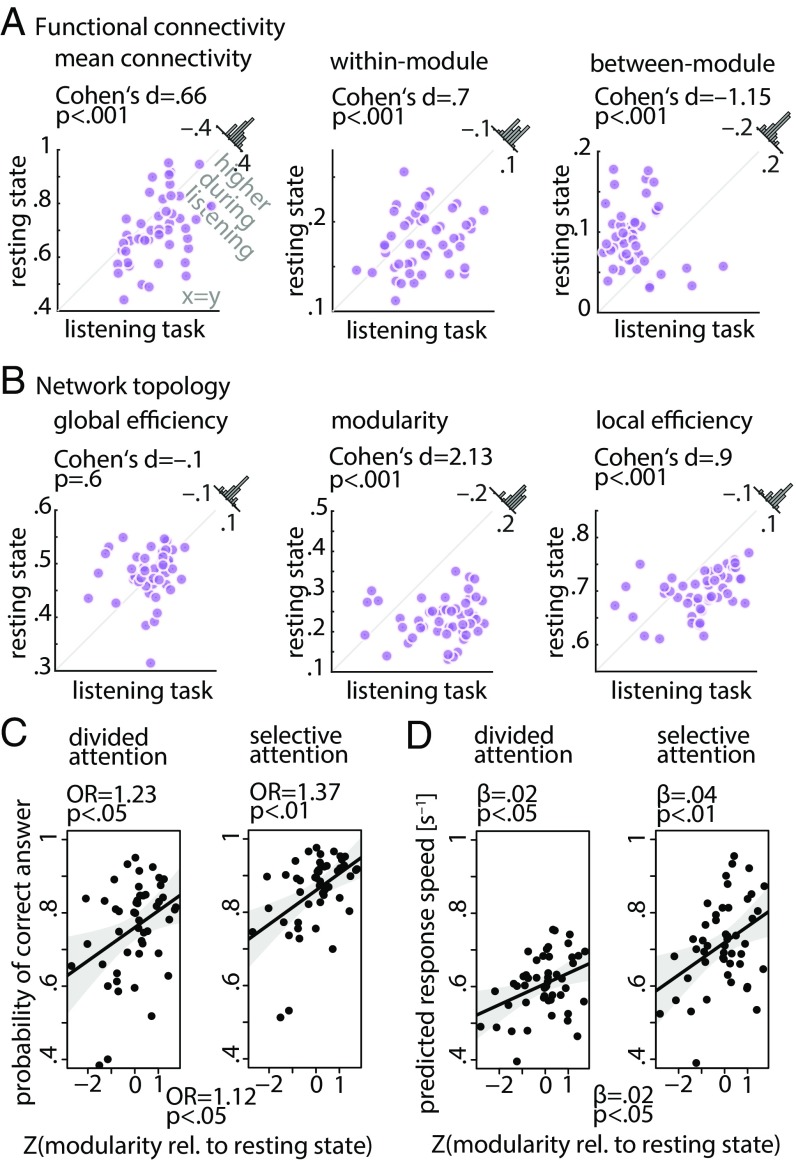
Speech comprehension in noisy, multitalker situations poses a challenge. Successful behavioral adaptation to a listening challenge often requires stronger engagement of auditory spatial attention and context-dependent semantic predictions. Human listeners differ substantially in the degree to which they adapt behaviorally and can listen successfully under such circumstances. How cortical networks embody this adaptation, particularly at the individual level, is currently unknown. We here explain this adaptation from reconfiguration of brain networks for a challenging listening task (i.e., a linguistic variant of the Posner paradigm with concurrent speech) in an age-varying sample of n = 49 healthy adults undergoing resting-state and task fMRI. We here provide evidence for the hypothesis that more successful listeners exhibit stronger task-specific reconfiguration (hence, better adaptation) of brain networks. From rest to task, brain networks become reconfigured toward more localized cortical processing characterized by higher topological segregation. This reconfiguration is dominated by the functional division of an auditory and a cingulo-opercular module and the emergence of a conjoined auditory and ventral attention module along bilateral middle and posterior temporal cortices. Supporting our hypothesis, the degree to which modularity of this frontotemporal auditory control network is increased relative to resting state predicts individuals' listening success in states of divided and selective attention. Our findings elucidate how fine-tuned cortical communication dynamics shape selection and comprehension of speech. Our results highlight modularity of the auditory control network as a key organizational principle in cortical implementation of auditory spatial attention in challenging listening situations.

Keywords: auditory cortex; cingulo-opercular network; functional connectome modularity; semantic prediction; spatial attention.


Conflict of interest statement

The authors declare no conflict of interest.

Figures

Fig. 1.
Fig. 1.
Two possible network reconfigurations (case 1 and case 2) characterized by a shift of the functional connectome toward either higher segregation (more localized cortical processing) or lower segregation (more distributed cortical processing) during a listening challenge. Global efficiency is inversely related to the sum of shortest path lengths between every pair of nodes, indicating the capacity of a network for parallel processing. Modularity describes the segregation of nodes into relatively dense subsystems (here shown in distinct colors), which are sparsely interconnected. Mean local efficiency is equivalent to global efficiency computed on the direct neighbors of each node, which is then averaged over all nodes. Toward higher functional segregation, the hypothetical baseline network loses the shortcut between the blue and green module (dashed link). Instead, within the green module, a new connection emerges (red link). Together, these form a segregated configuration tuned for a more localized cortical processing.
Fig. 2.
Fig. 2.
Listening task and individuals’ performance. (A) The linguistic Posner task with concurrent speech (i.e., cued speech comprehension). Participants listened to two competing dichotomously presented sentences. Each trial started with the visual presentation of a spatial cue. An informative cue provided information about the side (left ear vs. right ear) of the to be probed sentence final word (invoking selective attention). An uninformative cue did not provide information about the side of to be probed sentence final word (invoking divided attention). A semantic cue was visually presented, indicating a general or a specific semantic category for both sentence final words (allowing semantic predictions). At the end of each trial, a visual response array appeared on the left or right side of the screen with four word choices asking the participant to identify the final word of the sentence presented to the left or right ear, depending on the side of the response array. (B) Predictions from linear mixed effects models. Scattered data points (n = 49) represent trial-averaged predictions derived from the model. Black points and vertical lines show mean ± bootstrapped 95% CI. OR is the odds ratio parameter estimate resulting from generalized linear mixed effects models; β is the slope parameter estimate resulting from general linear mixed effects models.
Fig. 3.
Fig. 3.
Alterations in whole-brain network metrics during the listening task relative to the resting state. Functional segregation was significantly increased from rest to task. This was manifested in (A) higher within-module connectivity but lower between-module connectivity, and (B) higher network modularity and local efficiency, but lower global network efficiency. Histograms show the distribution of the change (task minus rest) of the network metrics across all 49 participants.
Fig. 4.
Fig. 4.
Modular reconfiguration of the whole-brain network in adaptation to the listening task. (A) The whole-brain resting-state network decomposed into six distinct modules shown in different colors. The network modules are visualized on the cortical surface, within the functional connectivity matrix, and on the connectogram using a consistent color scheme. Modules are functionally identified according to their node labels as in ref. . Group-level modularity partition and the corresponding modularity index were obtained using graph-theoretical consensus community detection. Gray peripheral bars around the connectograms indicate the number of connections per node. (B) Flow diagram illustrating the reconfiguration of brain network modules from resting state (Left) in adaptation to the listening task (Right). Modules shown in separate vertical boxes in Left and Right are sorted from bottom to top according to the total PageRank of the nodes that they contain, and their heights correspond to their connection densities. The streamlines illustrate how nodes belonging to a given module during resting state change their module membership during the listening task. (C) Whole-brain network modules during the listening task. The network construction and visualization scheme are identical to A. AG, angular gyrus; AUD, auditory; CO, cingulo-opercular; CS, central sulcus; DA, dorsal attention; DM, default mode; FP, frontoparietal; g., gyrus; HG, Heschl’s gyrus; post., posterior; SM, somatomotor; STG, superior temporal gyrus; sup., superior; VA, ventral attention; VIS, visual.
Fig. 5.
Fig. 5.
Modular reconfiguration of the frontotemporal auditory control network in adaptation to the listening task. (A) The auditory control network. Cortical regions across the resting-state frontotemporal map are functionally identified and color coded according to their node labels as in ref. . This network is decomposed into four distinct modules shown within the group-level functional connectivity matrix and the connectogram (circular diagram). Group-level modularity partition and the corresponding modularity index were obtained using graph-theoretical consensus community detection. Gray peripheral bars around the connectograms indicate the number of connections per node. (B, Upper) Flow diagram illustrating the reconfiguration of the auditory control network from resting state (Left) to the listening task (Right). Modules shown in separate vertical boxes in Left and Right are sorted from bottom to top according to the total PageRank of the nodes that they contain, and their heights correspond to their connection densities. The streamlines illustrate how nodes belonging to a given module during resting state change their module membership during the listening task. (B, Lower) Alteration in functional connectivity within the auditory control network complements the topological reconfiguration illustrated by the flow diagram (C) Modules of the auditory control network during the listening task. The network construction and visualization scheme are identical to A. Since auditory and ventral attention nodes are merged (yellow and orange nodes), an additional green–blue color coding is used for a clearer illustration of modules. AG, angular gyrus; ant., anterior; AUD, auditory; CO, cingulo-opercular; CS, central sulcus; g., gyrus; HG, Heschl’s gyrus; MFG, middle frontal gyrus; MTG, middle temporal gyrus; Operc., operculum; post., posterior; Pre/PoCG, pre-/postcentral gyrus; PoCG, postcentral gyrus; post., posterior; SFG, superior frontal gyrus; SMA, supplementary motor area; SMG, suparmarginal gyrus; STG, superior temporal gyrus; sup., superior; VA, ventral attention.
Fig. 6.
Fig. 6.
Brain network metrics derived from the frontotemporal auditory control network and prediction of listening success from modularity of this network. (A and B) Functional segregation within the auditory control network was significantly increased during the listening task relative to resting state. This was manifested in higher network modularity, within-module connectivity, and local network efficiency but lower between-module connectivity. Histograms show the distribution of the change (task minus rest) of the network metrics across all 49 participants. (C and D) Interaction of spatial cue and change in modularity of the auditory control network. The data points represent trial-averaged predictions derived from the (generalized) linear mixed effects model. Solid lines indicate linear regression fit to the trial-averaged data. Shaded area shows two-sided parametric 95% CIs. OR is the odds ratio (OR) parameter estimate resulting from generalized linear mixed effects models; β is the slope parameter estimate resulting from general linear mixed effects models.

Similar articles

Cited by

References

    1. Obleser J, Wise RJ, Dresner MA, Scott SK. Functional integration across brain regions improves speech perception under adverse listening conditions. J Neurosci. 2007;27:2283–2289. - PMC - PubMed
    1. Davis MH, Ford MA, Kherif F, Johnsrude IS. Does semantic context benefit speech understanding through “top-down” processes? Evidence from time-resolved sparse fMRI. J Cogn Neurosci. 2011;23:3914–3932. - PubMed
    1. Wöstmann M, Herrmann B, Maess B, Obleser J. Spatiotemporal dynamics of auditory attention synchronize with speech. Proc Natl Acad Sci USA. 2016;113:3873–3878. - PMC - PubMed
    1. Dai L, Best V, Shinn-Cunningham BG. Sensorineural hearing loss degrades behavioral and physiological measures of human spatial selective auditory attention. Proc Natl Acad Sci USA. 2018;115:E3286–E3295. - PMC - PubMed
    1. Colflesh GJ, Conway AR. Individual differences in working memory capacity and divided attention in dichotic listening. Psychon Bull Rev. 2007;14:699–703. - PubMed

Publication types

LinkOut - more resources