. 2019 Jan 2;116(1):148-157.
doi: 10.1073/pnas.1815345116. Epub 2018 Dec 26.

Toward understanding cancer stem cell heterogeneity in the tumor microenvironment

Affiliations

Toward understanding cancer stem cell heterogeneity in the tumor microenvironment

Federico Bocci et al. Proc Natl Acad Sci U S A. .

Abstract

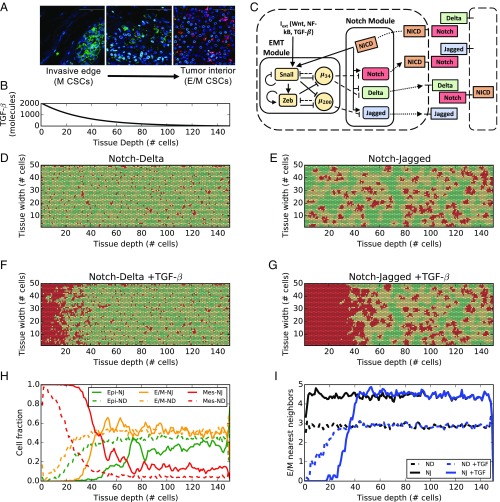
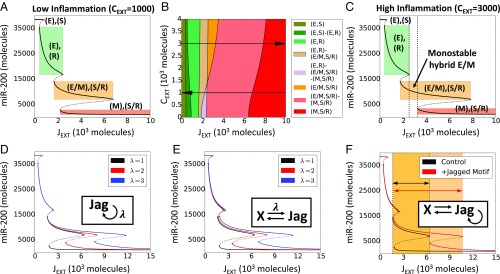
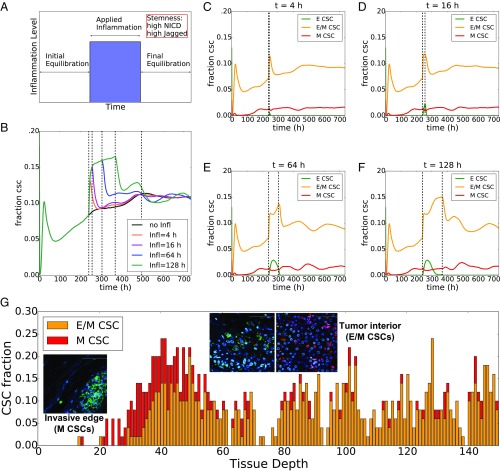
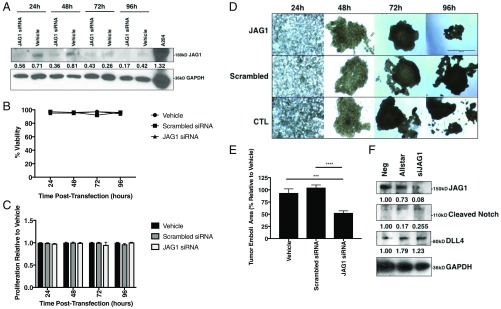
The epithelial-mesenchymal transition (EMT) and cancer stem cell (CSC) formation are two paramount processes driving tumor progression, therapy resistance, and cancer metastasis. Recent experiments show that cells with varying EMT and CSC phenotypes are spatially segregated in the primary tumor. The underlying mechanisms generating such spatiotemporal dynamics in the tumor microenvironment, however, remain largely unexplored. Here, we show through a mechanism-based dynamical model that the diffusion of EMT-inducing signals such as TGF-β, together with noncell autonomous control of EMT and CSC decision making via the Notch signaling pathway, can explain experimentally observed disparate localization of subsets of CSCs with varying EMT phenotypes in the tumor. Our simulations show that the more mesenchymal CSCs lie at the invasive edge, while the hybrid epithelial/mesenchymal (E/M) CSCs reside in the tumor interior. Further, motivated by the role of Notch-Jagged signaling in mediating EMT and stemness, we investigated the microenvironmental factors that promote Notch-Jagged signaling. We show that many inflammatory cytokines such as IL-6 that can promote Notch-Jagged signaling can (i) stabilize a hybrid E/M phenotype, (ii) increase the likelihood of spatial proximity of hybrid E/M cells, and (iii) expand the fraction of CSCs. To validate the predicted connection between Notch-Jagged signaling and stemness, we knocked down JAG1 in hybrid E/M SUM149 human breast cancer cells in vitro. JAG1 knockdown significantly restricted tumor organoid formation, confirming the key role that Notch-Jagged signaling can play in tumor progression. Together, our integrated computational-experimental framework reveals the underlying principles of spatiotemporal dynamics of EMT and CSCs.

Keywords: Notch signaling; breast tumor organoids; cancer stem cells; epithelial–mesenchymal transition; inflammation.


Conflict of interest statement

The authors declare no conflict of interest.

Figures

Fig. 1.
Fig. 1.
EMT phenotype patterning in the presence of EMT-induced Notch signaling. (A) Immunofluorescent staining of CD24 (magenta), CD44 (green), ALDH1 (red), and DAPI (blue) in human invasive breast carcinoma. Adapted from ref. . (Scale bars: 100 μm.) (B) Concentration of EMT-inducing signal as a function of tissue depth in the layer. Because the signal is secreted uniformly at one end of the layer, the profile is constant across the layer width. (C) Coupling between Notch pathway and core EMT regulatory circuit. Solid arrows/bars represent transcriptional activation/inhibition, while dashed lines represent posttranslational inhibition by microRNAs. Dotted lines represent translocation of Notch, Delta, and Jagged to the cell surface. (D) EMT phenotype distribution in the cell layer after 120 h of equilibration starting from randomized initial conditions and for a strong Notch-Delta signaling (gD = 90 molecules per hour, gJ = 20 molecules per hour). Green, yellow, and red colors denote epithelial (E), hybrid (E/M), and mesenchymal (M) cells, respectively. (E) Same as D, but for strong Notch-Jagged signaling (gD = 20 molecules per hour, gJ = 50 molecules per hour). (F) Same as D in the presence of TGF-β gradient in the tissue layer. (G) Same as E in the presence of TGF-β gradient in the tissue layer. (H) Fraction of E, hybrid E/M, and M cells as a function of tissue depth corresponding to F (dashed lines) and (G) (continuous lines). (I) Average number of E/M nearest neighbors of the hybrid E/M cells as a function of tissue depth for the four cases of DG. H and I present an average over 10 simulations starting from random initial conditions.
Fig. 2.
Fig. 2.
Inflammation stabilizes a hybrid E/M phenotype. (A) Bifurcation curves of miR-200 as a function of JEXT for low inflammation (CEXT = 1,000 molecules). (B) Cell phenotype diagram as a function of external Jagged (JEXT) and external cytokines (CEXT). The different colors represent portions of parameter space characterized by monostability or multistability of the coupled Notch-EMT system. (C) Represents the same case as A, but for high inflammation (CEXT = 3,000 molecules). Solid lines represent stable steady states, and dotted lines represent unstable steady states. Vertical dotted lines in C depict the range of control parameter values that allows for monostability of the (E/M, S/R) state. The colored rectangles in A and C elucidate the interval of (JEXT) values for which different states of coupled EMT-Notch circuitry are stable, and the corresponding level of miR-200. For this simulation, the external concentrations of Notch and Delta are fixed at NEXT = 10,000 molecules, DEXT = 0 molecules (36). Bifurcation diagrams for all model’s variables are presented in SI Appendix, Fig. S3B. (DF) Bifurcation diagram of miR-200 in presence of self-activation of Jagged (D), positive feedback loop between Jagged and another additional component (E), and a combination of both (F). Color shading in F shows the increased stability of the hybrid E/M phenotype in presence of the Jagged motif. Hill coefficient(s) is(are), unless stated otherwise, n = 2. In D, λ is the fold change in production rate of Jagged due to the activation by X, while in E it represents the fold change of both interactions. In F, all λ = 2.
Fig. 3.
Fig. 3.
Inflammation increases the CSC population. (A) Schematic of simulation setup: the 2D layer of cells undergoes initial equilibration for 240 h (initial conditions for proteins and microRNAs are extracted randomly); an inflammatory signal constant through the layer (CEXT = 3,000 molecules) is applied for a variable time interval (blue region); after the inflammation is removed, the system equilibrates. (B) Temporal dynamics of the fraction of CSC for different durations of applied inflammation and comparison with control (no applied inflammation, black curve). The first vertical dotted line from the left indicates the time when the inflammation is applied (same for all curves); the four successive dotted lines depict the end of the applied inflammation for the different curves. (CF) Temporal dynamics of the fraction of epithelial, hybrid E/M, and mesenchymal CSC. In C, for a short inflammation period (t = 4 h) the spike in CSC population is due to hybrid E/M cells. In this simulation, the production rates of Jagged and Delta are gJ = 50 molecules per hour, gD = 25 molecules per hour, respectively (as in Fig. 2). (G) Fraction of CSCs with different EMT phenotypes as a function of tissue depth in the cell layer for the (Notch-Jagged, TGF-β gradient) of panel Fig. 1G. Insets show the spatial distribution of M-CSC by the invasive edge of the tumor and E/M-CSC in the tumor interior. Adapted from ref. . (Scale bars: 100 μm.)
Fig. 4.
Fig. 4.
JAG1 knockdown reduces organoid size and decreases Notch-JAG1 signaling in SUM149 cells. (A) Western blot of SUM149 cells for JAG1 and GAPDH proteins following treatment with JAG1 siRNA or transfection reagent alone for 24, 48, 72, or 96 h. JAG1 protein levels normalized to GAPDH. (B) Percent viability and (C) 2D proliferation relative to vehicle of SUM149 cells at 24, 48, 72, and 96 h time points following JAG1 siRNA, scrambled siRNA, or vehicle treatment. (D) Representative 40× magnification images and (E) area quantification of SUM149 tumor emboli treated with JAG1 siRNA, scrambled siRNA, or vehicle alone at days 1, 2, 3, and 4 posttransfection. (Scale bar: 500 μm.) (F) Western immunoblot analysis for JAG1, cleaved Notch, DLL4, and IL-6 proteins at t = 96 h from SUM149 tumor emboli lysates, normalized to GAPDH and to negative untreated cells. A204, human muscle rhabdomyosarcoma cell lysate used for antibody control. ***P < 0.001, ****P < 0.0001 by one-way ANOVA and Fisher's least significant difference post hoc test, n = 6.

Similar articles

Cited by

References

    1. Carmona-Fontaine C, et al. Emergence of spatial structure in the tumor microenvironment due to the Warburg effect. Proc Natl Acad Sci USA. 2013;110:19402–19407. - PMC - PubMed
    1. Dai Z, Locasale JW. Metabolic pattern formation in the tumor microenvironment. Mol Syst Biol. 2017;13:915. - PMC - PubMed
    1. Yuan Y. Spatial heterogeneity in the tumor microenvironment. Cold Spring Harb Perspect Med. 2016;6:a026583. - PMC - PubMed
    1. Carmona-Fontaine C, et al. Metabolic origins of spatial organization in the tumor microenvironment. Proc Natl Acad Sci USA. 2017;114:2934–2939. - PMC - PubMed
    1. Boareto M, et al. Notch-Jagged signalling can give rise to clusters of cells exhibiting a hybrid epithelial/mesenchymal phenotype. J R Soc Interface. 2016;13:20151106. - PMC - PubMed

Publication types

MeSH terms

LinkOut - more resources