. 2018 Nov 5;15(14):1676-1685.
doi: 10.7150/ijms.28728. eCollection 2018.

Elevated mRNA Levels of AURKA, CDC20 and TPX2 are associated with poor prognosis of smoking related lung adenocarcinoma using bioinformatics analysis

Affiliations

Elevated mRNA Levels of AURKA, CDC20 and TPX2 are associated with poor prognosis of smoking related lung adenocarcinoma using bioinformatics analysis

Meng-Yu Zhang et al. Int J Med Sci. .

Abstract

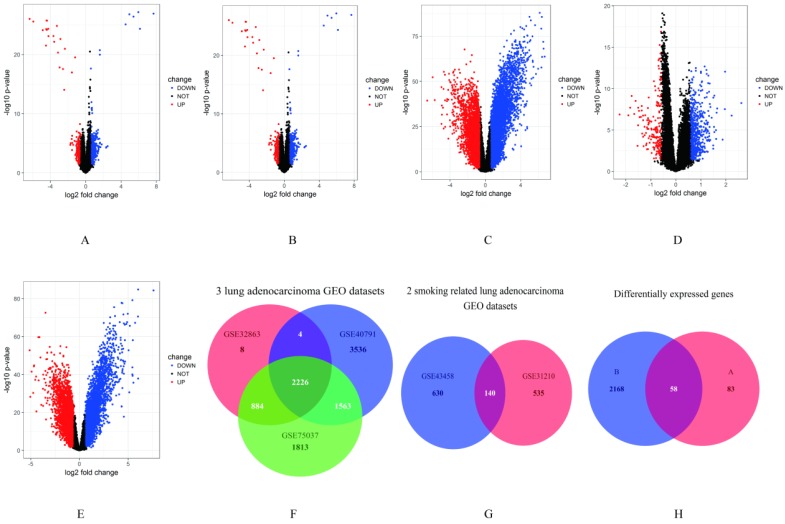
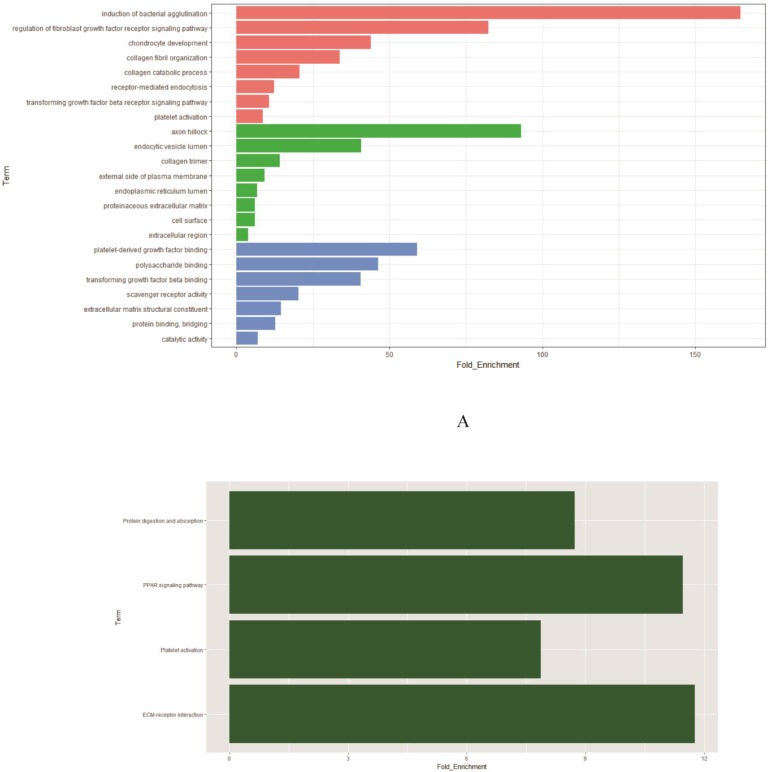
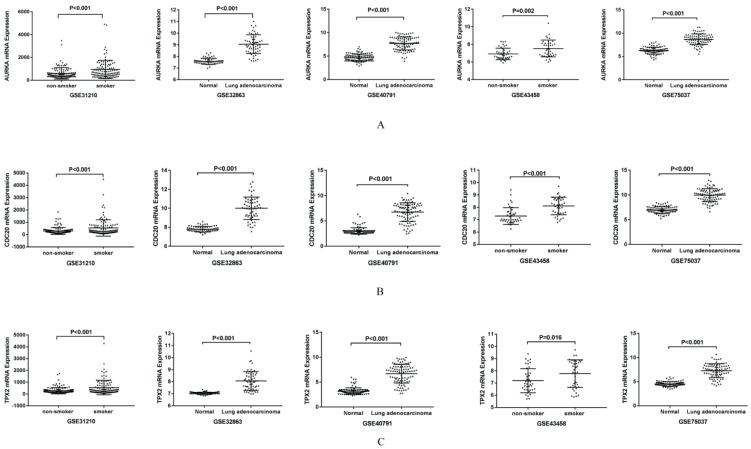
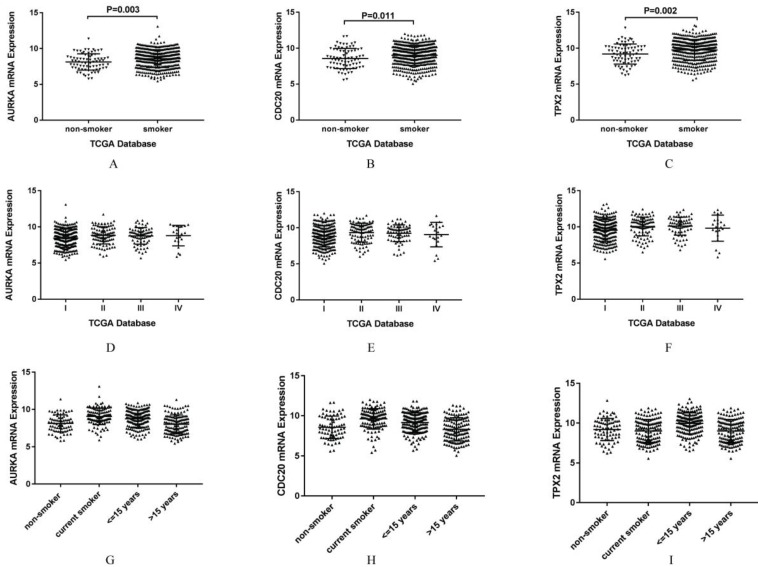
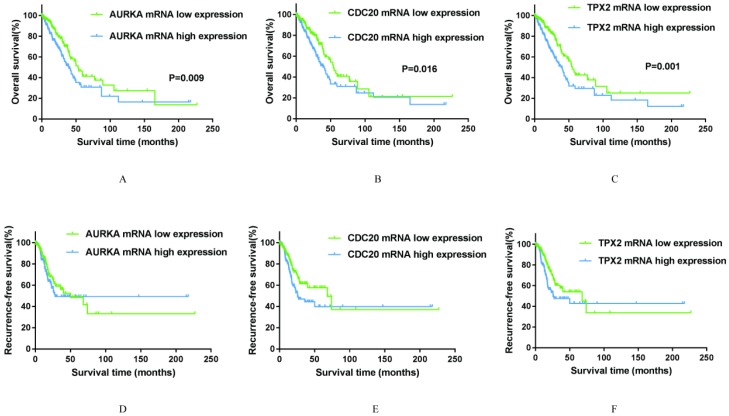
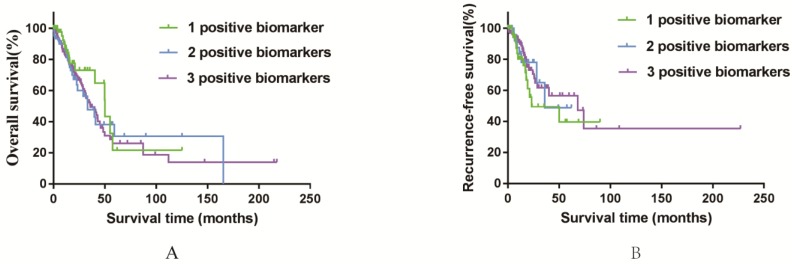
Background and aim: Adenocarcinoma is a very common pathological subtype for lung cancer. We aimed to identify the gene signature associated with the prognosis of smoking related lung adenocarcinoma using bioinformatics analysis. Methods: A total of five gene expression profiles (GSE31210, GSE32863, GSE40791, GSE43458 and GSE75037) have been identified from the Gene Expression Omnibus (GEO) database. Differentially expressed genes (DEGs) were analyzed using GEO2R software and functional and pathway enrichment analysis. Furthermore, the overall survival (OS) and recurrence-free survival (RFS) have been validated using an independent cohort from the Cancer Genome Atlas (TCGA) database. Results: We identified a total of 58 DEGs which mainly enriched in ECM-receptor interaction, platelet activation and PPAR signaling pathway. Then according to the enrichment analysis results, we selected three genes (AURKA, CDC20 and TPX2) for their roles in regulating tumor cell cycle and cell division. The results showed that the hazard ratio (HR) of the mRNA expression of AURKA for OS was 1.588 with (1.127-2.237) 95% confidence interval (CI) (P=0.009). The mRNA levels of CDC20 (HR 1.530, 95% CI 1.086-2.115, P=0.016) and TPX2 (HR 1.777, 95%CI 1.262-2.503, P=0.001) were also significantly associated with the OS. Expression of these three genes were not associated with RFS, suggesting that there might be many factors affect RFS. Conclusion: The mRNA signature of AURKA, CDC20 and TPX2 were potential biomarkers for predicting poor prognosis of smoking related lung adenocarcinoma.

Keywords: Kaplan-Meier analysis; biomarkers; differentially expressed genes; gene ontology; lung adenocarcinoma.


Conflict of interest statement

Competing Interests: The authors have declared that no competing interest exists.

Figures

Figure 1
Figure 1
Identification of DEGs. A-E. Volcano plots of the different mRNA expression analysis. X-axis: log 2 fold change; Y-axis: -log10 p-value for each probes; A: There were 829 genes identified to be differentially expressed in GSE31210, including 274 up-regulated and 555 down-regulated genes. B: 3564 genes (1682 up-regulated and 1882 down-regulated genes) identified to be differentially expressed in GSE32863. C: 10896 genes (5064 up-regulated and 5832 down-regulated genes) differentially expressed in GSE40791. D: 831 genes (195 up-regulated and 636 down-regulated genes) in GSE43458. E: 7726 genes (3771 up-regulated and 3955 down-regulated genes) in GSE75037. F-H. Overlap analysis between different datasets. F: A total of 2226 genes were significantly differentially expressed in three lung adenocarcinoma GEO datasets. G: 140 genes were overlapped in two smoking related lung adenocarcinoma GEO datasets. H: There were 58 overlapping genes significantly differentially expressed between smokers and non-smoers of lung adenocarcinoma in five GEO datasets.
Figure 2
Figure 2
Functional enrichment analysis of 58 DEGs. A: The significantly enriched GO categories were calculated. Blue: Molecular function; Green: Cellular component; Red: Biological process. B: Gene networks identified through KEGG analysis of the DEGs.
Figure 3
Figure 3
Validation of the gene expression in five GEO datasets. A: Validation of mRNA expression of AURKA in five GEO datasets. B: Validation of mRNA expression of CDC20 in five GEO datasets. C: Validation of mRNA expression of TPX2 in five GEO datasets.
Figure 4
Figure 4
A-C. Validation of the gene expression between non-smoker lung adenocarcinoma and smoker lung adenocarcinoma. A: Validation of mRNA expression of AURKA in TCGA database. B: Validation of mRNA expression of CDC20 in TCGA database. C: Validation of mRNA expression of TPX2 in TCGA database. D-F. Gene expression of smoking related lung adenocarcinoma according to clinical stage in TCGA database. D: AURKA mRNA expression of smoking related lung adenocarcinoma according to clinical stage of TCGA database. E: CDC20 mRNA expression of smoking related lung adenocarcinoma according to clinical stage in TCGA database. F: TPX2 mRNA expression of smoking related lung adenocarcinoma according to clinical stage in TCGA database. G-I. Gene expression of smoking related lung adenocarcinoma according to smoking history in TCGA database. G: AURKA mRNA expression of smoking related lung adenocarcinoma according to smoking history in TCGA database. H: CDC20 mRNA expression of smoking related lung adenocarcinoma according to smoking history in TCGA database. I: TPX2 mRNA expression of smoking related lung adenocarcinoma according to smoking history in TCGA database.
Figure 5
Figure 5
Kaplan-Meier survival curves by different mRNA expression levels of AURKA, CDC20 and TPX2 of 497 smoking related lung adenocarcinoma in TCGA database. A: OS between low and high AURKA mRNA expression. B: OS between low and high CDC20 mRNA expression. C: OS between low and high TPX2 mRNA expression. D: RFS between low and high AURKA mRNA expression. E: RFS between low and high CDC20 mRNA expression. F: RFS between low and high TPX2 mRNA expression.
Figure 6
Figure 6
Kaplan-Meier survival curves by different groups of 497 smoking related lung adenocarcinoma in TCGA database. A: OS among three different groups. B: RFS among three different groups.

Similar articles

Cited by

References

    1. Siegel RL, Miller KD, Jemal A. Cancer statistics. CA Cancer J Clin. 2016;66:7–30. - PubMed
    1. Siegel RL, Miller KD, Jemal A. Cancer statistics. CA Cancer J Clin. 2017;67:7–30. - PubMed
    1. Zappa C, Mousa SA. Non-small cell lung cancer: current treatment and future advances. Transl Lung Cancer Res. 2016;5:288–300. - PMC - PubMed
    1. Tanner NT, Kanodra NM, Gebregziabher M. et al. The association between smoking abstinence and mortality in the National Lung Screening Trial. Am J Respir Crit Care Med. 2016;193:534–41. - PubMed
    1. Govindan R, Ding L, Griffith M. et al. Genomic landscape of non-small cell lung cancer in smokers and never-smokers. Cell. 2012;150:1121–34. - PMC - PubMed

MeSH terms