

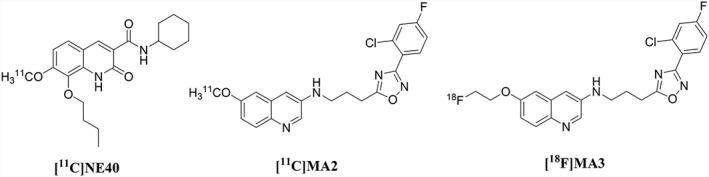
Preclinical evaluation of [18 F]MA3: a CB2 receptor agonist radiotracer for PET
- PMID: 30588600
- PMCID: PMC6487560
- DOI: 10.1111/bph.14564
Preclinical evaluation of [18 F]MA3: a CB2 receptor agonist radiotracer for PET
Abstract
Background and purpose: Non-invasive in vivo imaging of cannabinoid CB2 receptors using PET is pursued to study neuroinflammation. The purpose of this study is to evaluate the in vivo binding specificity of [18 F]MA3, a CB2 receptor agonist, in a rat model with local overexpression of human (h) CB2 receptors.
Methods: [18 F]MA3 was produced with good radiochemical yield and radiochemical purity. The radiotracer was evaluated in rats with local overexpression of hCB2 receptors and in a healthy non-human primate using PET.
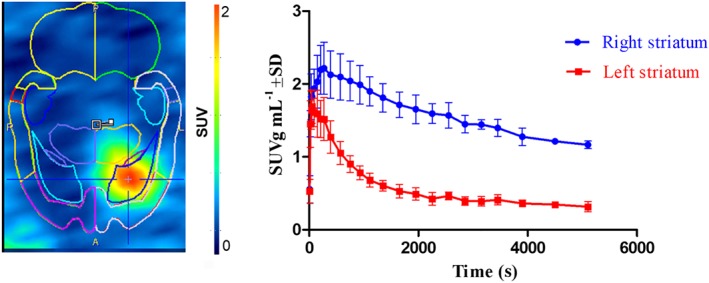
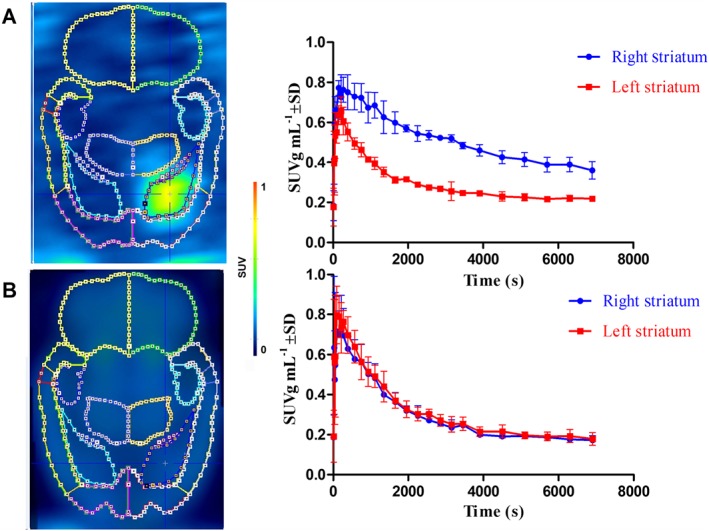
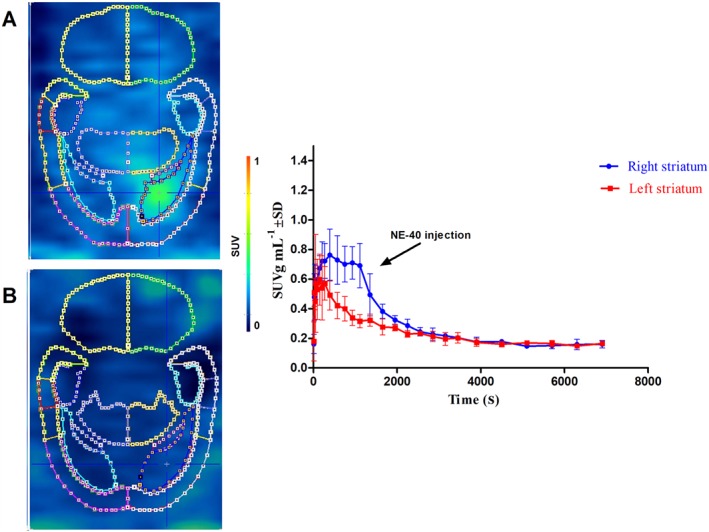
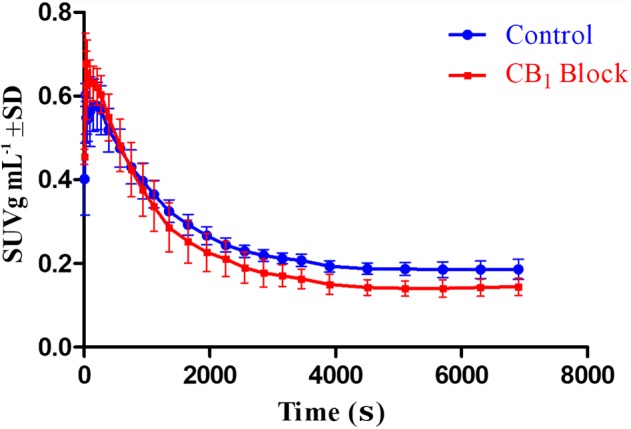
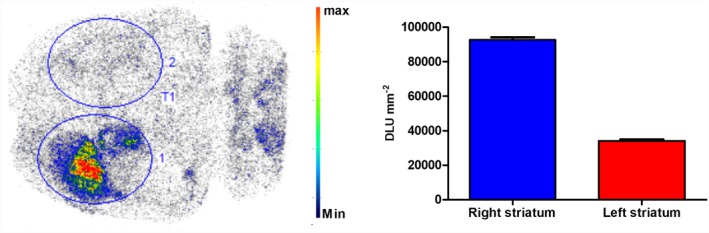
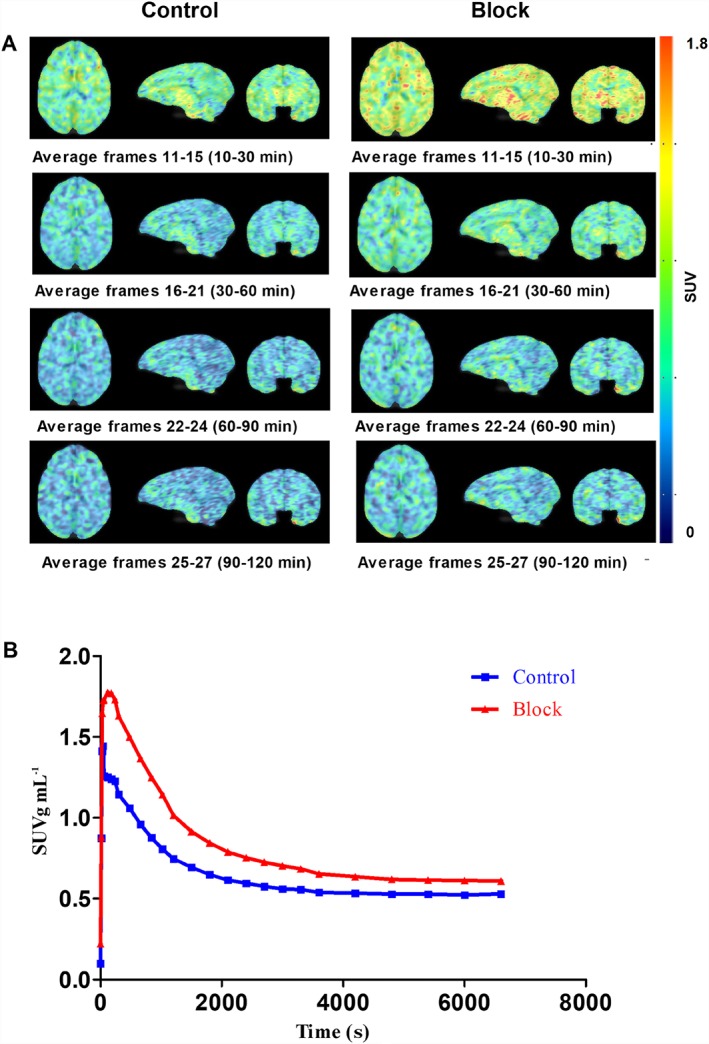
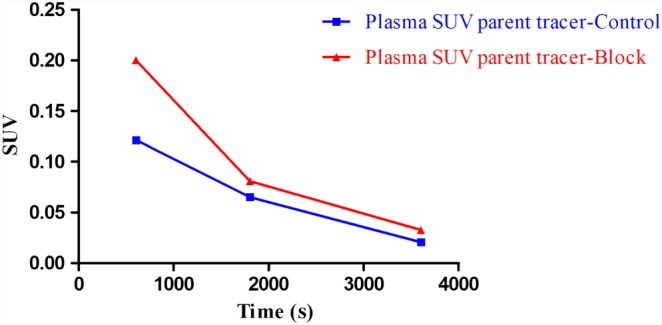
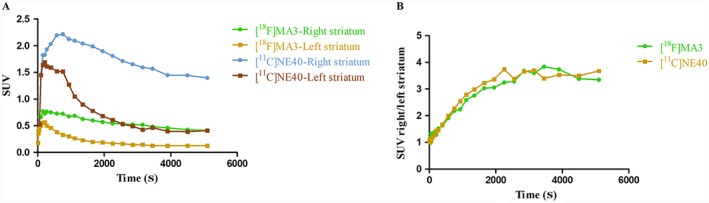
Key results: Ex vivo autoradiography demonstrated CB2 -specific binding of [18 F]MA3 in rat hCB2 receptor vector injected striatum. In a PET study, increased tracer binding in the hCB2 receptor vector-injected striatum compared to the contralateral control vector-injected striatum was observed. Binding in hCB2 receptor vector-injected striatum was blocked with a structurally non-related CB2 receptor inverse agonist, and a displacement study confirmed the reversibility of tracer binding. This study identified the utility of mutated inactive vector model for evaluation of CB2 receptor agonist PET tracers. [18 F]MA3 PET scans in the non-human primate showed good uptake and fast washout from brain, but no CB2 receptor-specific binding was observed.
Conclusion and implications: Evaluation of [18 F]MA3 in a rat model with local overexpression of hCB2 receptors showed CB2 receptor-specific and reversible tracer binding. [18 F]MA3 showed good brain uptake and subsequent washout in a healthy non-human primate, but no specific binding was observed. Further clinical evaluation of [18 F]MA3 in patients with neuroinflammation is warranted.
Linked articles: This article is part of a themed section on 8th European Workshop on Cannabinoid Research. To view the other articles in this section visit http://onlinelibrary.wiley.com/doi/10.1111/bph.v176.10/issuetoc.
© 2018 The British Pharmacological Society.
Conflict of interest statement
The authors declare no conflicts of interest.
Figures
References
-
- Ahmad R, Koole M, Evens N, Serdons K, Verbruggen A, Bormans G et al (2013). Whole‐body biodistribution and radiation dosimetry of the cannabinoid type 2 receptor ligand [11C]‐NE40 in healthy subjects. Mol Imaging Biol 15: 384–390. - PubMed
Publication types
MeSH terms
Substances
LinkOut - more resources
Full Text Sources
