Flexibly modeling alcohol use disorder risk: How many drinks should we count?
- PMID: 30589310
- PMCID: PMC6521945
- DOI: 10.1037/adb0000431
Flexibly modeling alcohol use disorder risk: How many drinks should we count?
Abstract
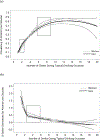
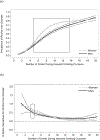
Previous research has called the validity of the commonly used 4 +/5 + (women/men, respectively) definition for heavy episodic drinking (HED) into question. This definition does not allow researchers to capture the considerable heterogeneity among heavy, "at risk" drinkers. Spline regression methods were used to identify a flattening in the curve in the relationship between number of drinks consumed and prevalence of past-year alcohol use disorder (AUD). This analysis could identify the number of drinks above which no significant additional risk for AUD is conferred. Data were from the National Epidemiologic Survey on Alcohol and Related Conditions-III. The analytic sample consisted of young adult past-year drinkers (n = 6,422). Sex-specific drinking thresholds varied as a function of the number of drinks consumed during past-year typical and heaviest drinking occasions. For typical drinking, the risk for AUD continued to increase through approximately 10 (women) and 11 (men) drinks, after which AUD risk remained constant. That is, young adult drinkers experienced incremental risk for AUD through approximately a typical amount of 10 drinks, after which the risk for AUD plateaued. For heaviest drinking occasion, risk for AUD continued to increase for men and tapered for women around 14 drinks. There is incremental information gained at each level of drinking in predicting AUD, well beyond the traditional 4 +/5 + HED thresholds. Relying solely on this threshold may limit the understanding of serious harms that many young adults who drink at higher levels can experience. (PsycINFO Database Record (c) 2019 APA, all rights reserved).
Figures


References
-
- Allen JP (2003). Measuring outcome in interventions for alcohol dependence for problem drinking: Executive summary of a conference sponsored by the National Institute on Alcohol Abuse and Alcoholism. Alcoholism: Clinical and Experimental Research, 27, 1657–1660. - PubMed
-
- Andreasson S (2016). Better options than self-report of consumption. Addiction, 111, 1727–1728. - PubMed
-
- Beirness DJ, Foss RD, & Vogel-Sprott M (2004). Drinking on campus: Self-reports and breath tests. Journal of Studies on Alcohol and Drugs, 65, 600–604. - PubMed
-
- Center for Behavioral Health Statistics and Quality. (2016). 2015 National Survey on Drug Use and Health: Detailed Tables. Substance Abuse and Mental Health Services Administration, Rockville, MD.
MeSH terms
Grants and funding
LinkOut - more resources
Full Text Sources
Medical
Miscellaneous

