. 2019 Mar;43(3):425-438.
doi: 10.1111/acer.13946. Epub 2019 Jan 20.

A Pivotal Role for Thiamine Deficiency in the Expression of Neuroinflammation Markers in Models of Alcohol-Related Brain Damage

Affiliations

A Pivotal Role for Thiamine Deficiency in the Expression of Neuroinflammation Markers in Models of Alcohol-Related Brain Damage

Polliana Toledo Nunes et al. Alcohol Clin Exp Res. 2019 Mar.

Abstract

Background: Alcohol-related brain damage (ARBD) is associated with neurotoxic effects of heavy alcohol use and nutritional deficiency, in particular thiamine deficiency (TD), both of which induce inflammatory responses in brain. Although neuroinflammation is a critical factor in the induction of ARBD, few studies have addressed the specific contribution(s) of ethanol (EtOH) versus TD.

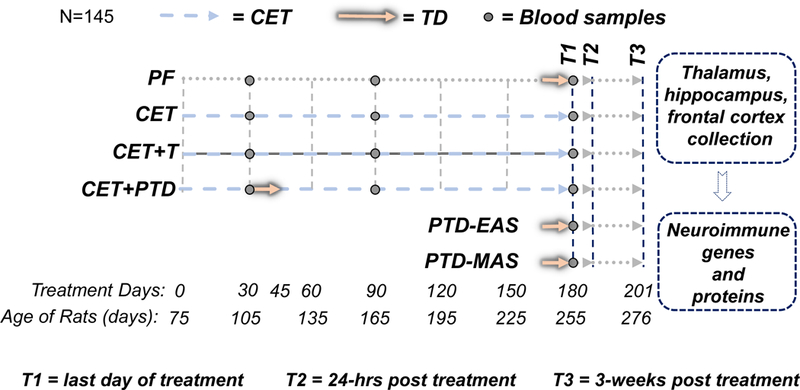
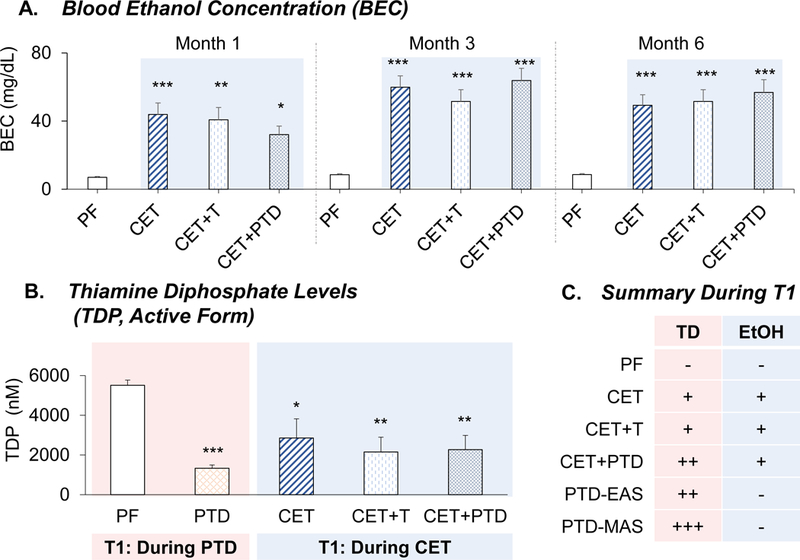
Methods: Adult rats were randomly divided into 6 conditions: chronic EtOH treatment (CET) where rats consumed a 20% v/v solution of EtOH for 6 months; CET with injections of thiamine (CET + T); severe pyrithiamine-induced TD (PTD); moderate PTD; moderate PTD during CET; and pair-fed controls. After the treatments, the rats were split into 3 recovery phase time points: the last day of treatment (time point 1), acute recovery (time point 2: 24 hours posttreatment), and delayed recovery (time point 3: 3 weeks posttreatment). At these time points, vulnerable brain regions (thalamus, hippocampus, frontal cortex) were collected and changes in neuroimmune markers were assessed using a combination of reverse transcription polymerase chain reaction and protein analysis.

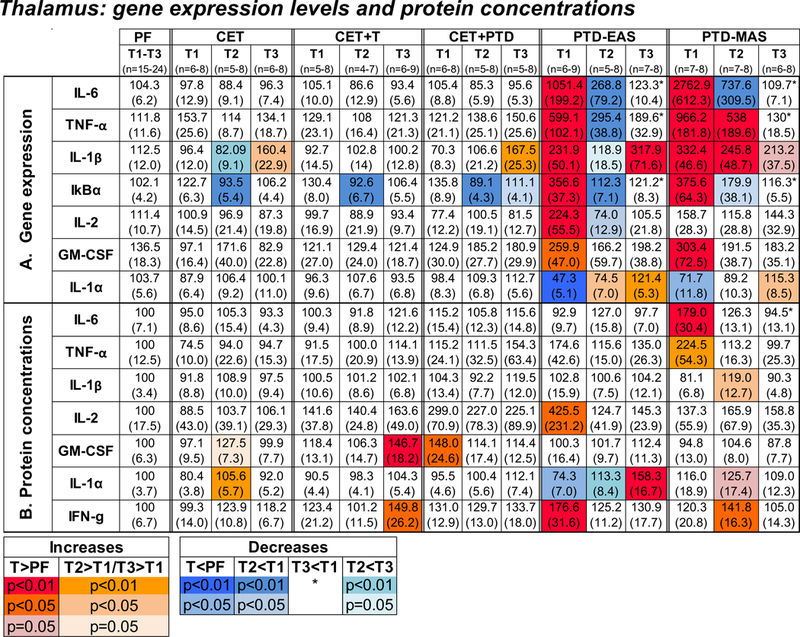
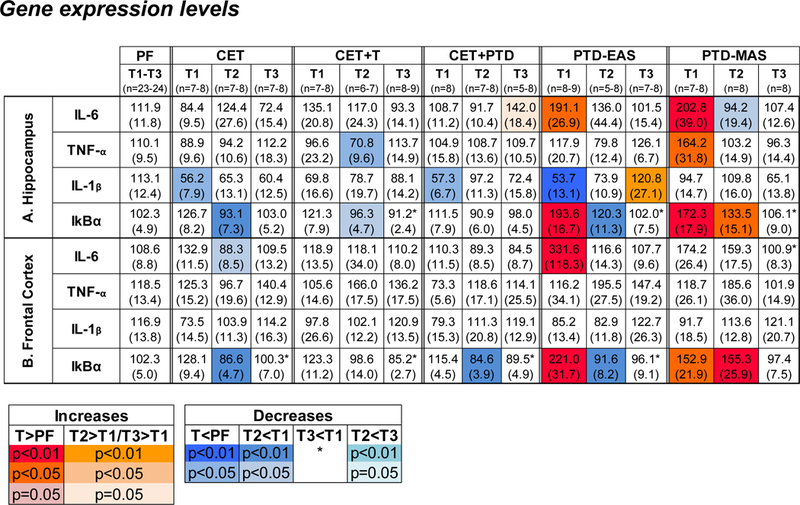
Results: CET led to minor fluctuations in neuroimmune genes, regardless of the structure being examined. In contrast, PTD treatment led to a profound increase in neuroimmune genes and proteins within the thalamus. Cytokine changes in the thalamus ranged in magnitude from moderate (3-fold and 4-fold increase in interleukin-1β [IL-1β] and IκBα) to severe (8-fold and 26-fold increase in tumor necrosis factor-α and IL-6, respectively). Though a similar pattern was observed in the hippocampus and frontal cortex, overall fold increases were moderate relative to the thalamus. Importantly, neuroimmune gene induction varied significantly as a function of severity of TD, and most genes displayed a gradual recovery across time.

Conclusions: These data suggest an overt brain inflammatory response by TD and a subtle change by CET alone. Also, the prominent role of TD in the immune-related signaling pathways leads to unique regional and temporal profiles of induction of neuroimmune genes.

Keywords: Alcohol-Related Brain Damage; Chronic EtOH Exposure; Cytokines; Neuroinflammation; Thiamine Deficiency.


Conflict of interest statement

The authors have no other conflicts of interest.

Figures

Figure 1.
Figure 1.. Experimental design
Schematic of the experimental design. Rats were randomly assigned to one of six treatment conditions: (1) PF (control pair-fed); (2) CET (chronic EtOH); (3) CET+T (CET combined with injections of thiamine – 3 times per week); (4) after 1-month, some CET subjects were exposed to moderate PTD-EAS (CET+PTD); other sets of rats were assigned to (5) PTD-EAS (moderate pyrithiamine-induced TD) or (6) PTD-MAS (treatment severe pyrithiamine-induced TD). All groups were further separated into three different time-points at which brain samples (thalamus, hippocampus and frontal cortex) were collected: Time-point 1 (T1) was last day of treatment; Time-point 2 (T2 = acute recovery) was 24-hours after treatment; Time-point 3 (T3) was 3-weeks post-treatment (delayed recovery) following treatment. The blood EtOH concentrations (BEC) were determined at months 1, 3 and 6, and thiamine diphosphate (TDP) was determined in the final week of treatment.
Figure 2.
Figure 2.. Ethanol and thiamine concentrations in blood.
Levels (mean ± SEM) of blood EtOH concentration (BEC) and thiamine diphosphate (TDP). (A) The CET groups had significantly higher BECs than PF controls at months 1, 3 and 6 (p < 0.005). (B) Levels of TDP were decreased during treatment (Time-point 1 = T1) in both CET and PTD groups, compared to the PF group (p < 0.05). (C) Summary of thiamine deficiency (TD) and chronic EtOH (EtOH) treatments at Time-point 1 in the different experimental condition (+ and - symbols means the presence and absence of the TD and EtOH in each treatment groups). *p < 0.05, **p < 0.005, ***p < 0.0001. CET, chronic EtOH treatment; PF, pair-fed; PTD, pyrithiamine-induced thiamine deficiency.
Figure. 3
Figure. 3. Heat map of gene expression and protein concentrations in thalamus
Heat map of changes in gene expression (A) and proteins concentrations (B) of interleukins (IL-6, IL-1β, IL-2, IL-1α), nuclear factor of kappa light polypeptide gene enhancer in B-cells inhibitor, alpha (IκBα), tumor necrosis factor-α (TNF-α), granulocyte-macrophage colony-stimulating factor (GM-CSF) and interferon-gamma (IFN-γ) in thalamus. The gene expression data are expressed relative to the ultimate control group (% of PF control in time-points 1, 2 and 3) and the protein concentration are represented as % of control (PF). In this figure, as well as in all other, the number of animals (n), the average and the standard error of the mean (SEM) are indicated for PF group combined (average of Time-points 1, 2 and 3 combined) and for Time-point 1 (T1), Time-point 2 (T2) and Time-point 3 (T3) in each condition treatment. All post hoc comparisons between PF and treatment groups at each Time-point, as well as comparisons across time points within each treatment condition, were made using Bonferroni post hoc tests. The differences between Treatment conditions and differences across time points are represented with red indicating highest levels and blue indicating lowest levels (p < 0.05).
Figure. 4
Figure. 4. Heat map of gene expression in hippocampus and frontal cortex
Heat map of changes in gene expression of interleukins (IL-6 and IL-1β), and tumor necrosis factor-α (TNF-α), and nuclear factor of kappa light polypeptide gene enhancer in B-cells inhibitor, alpha (IκBα) were assessed in the hippocampus (A) and frontal cortex (B). The gene expression data are expressed relative to the ultimate control group (% of PF control in Time-points 1, 2 and 3). Bonferroni post hoc tests were used for comparisons between PF and treatment groups at each Time-point, as well as comparisons across time points within each treatment condition. The differences between Treatment conditions and differences across Time-points are represented with red indicating highest levels and blue indicating lowest levels (p < 0.05).

Similar articles

Cited by

References

    1. Aggleton JP, Brown MW (1999) Episodic memory, amnesia, and the hippocampal-anterior thalamic axis. Behav Brain Sci 22:425–444; discussion 444–489. - PubMed
    1. Alfonso-Loeches S, Pascual-Lucas M, Blanco AM, Sanchez-Vera I, Guerri C (2010) Pivotal role of TLR4 receptors in alcohol-induced neuroinflammation and brain damage. J Neurosci 30:8285–8295. - PMC - PubMed
    1. Aloe L, Tirassa P (1992) The effect of long-term alcohol intake on brain NGF-target cells of aged rats. Alcohol 9:299–304. - PubMed
    1. Alves S, Churlaud G, Audrain M, Michaelsen-Preusse K, Fol R, Souchet B, Braudeau J, Korte M, Klatzmann D, Cartier N (2017) Interleukin-2 improves amyloid pathology, synaptic failure and memory in Alzheimer’s disease mice. Brain 140:826–842. - PubMed
    1. Anzalone S, Vetreno RP, Ramos RL, Savage LM (2010) Cortical cholinergic abnormalities contribute to the amnesic state induced by pyrithiamine-induced thiamine deficiency in the rat. Eur J Neurosci 32:847–858. - PMC - PubMed

Publication types

Associated data