. 2019 Mar 1;129(3):1211-1228.
doi: 10.1172/JCI123319. Epub 2019 Feb 11.

PARP inhibition enhances tumor cell-intrinsic immunity in ERCC1-deficient non-small cell lung cancer

Affiliations

PARP inhibition enhances tumor cell-intrinsic immunity in ERCC1-deficient non-small cell lung cancer

Roman M Chabanon et al. J Clin Invest. .

Abstract

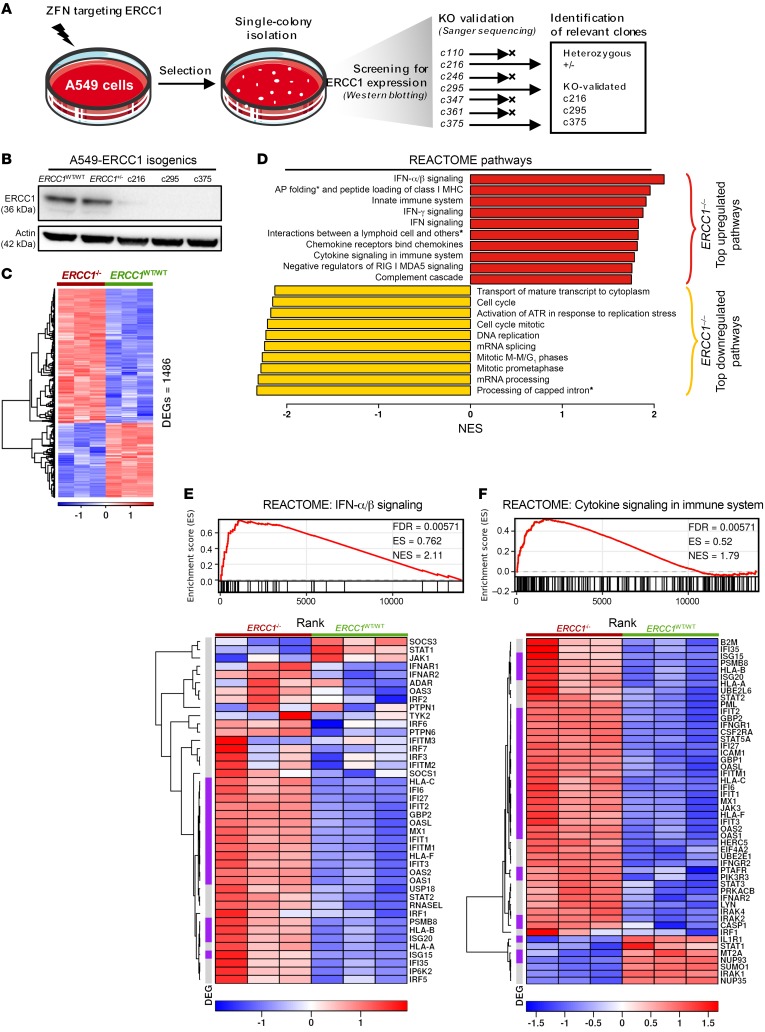
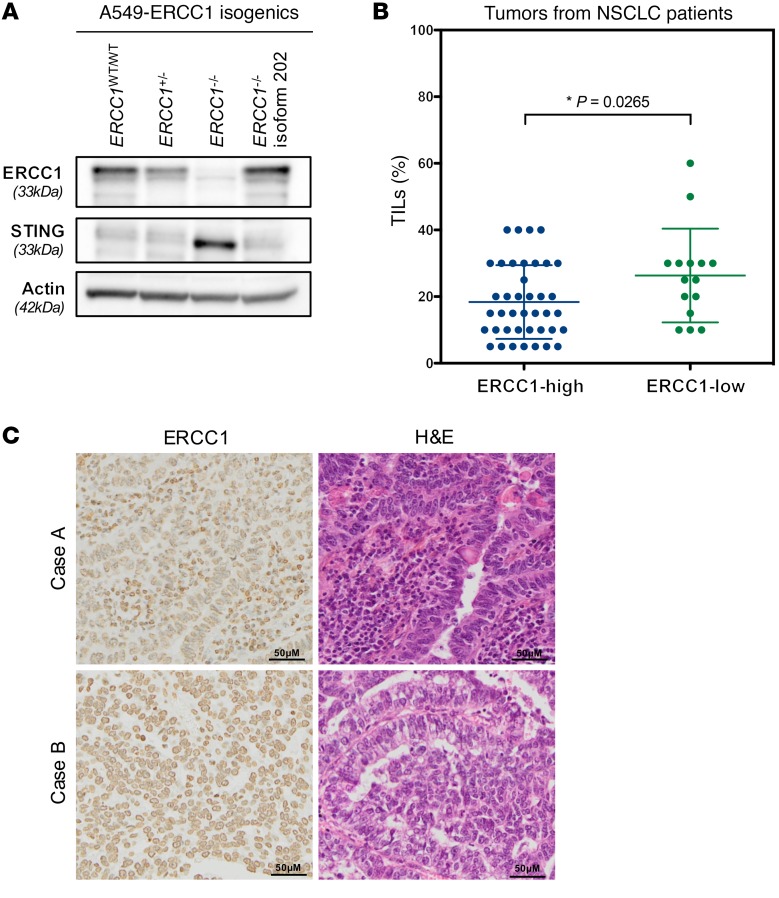
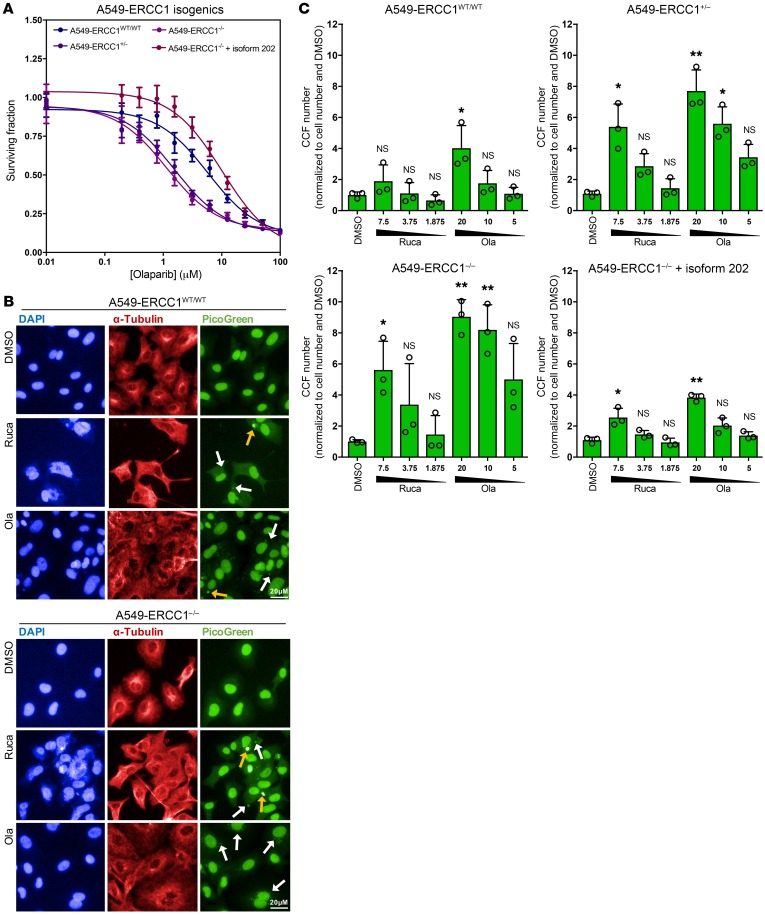
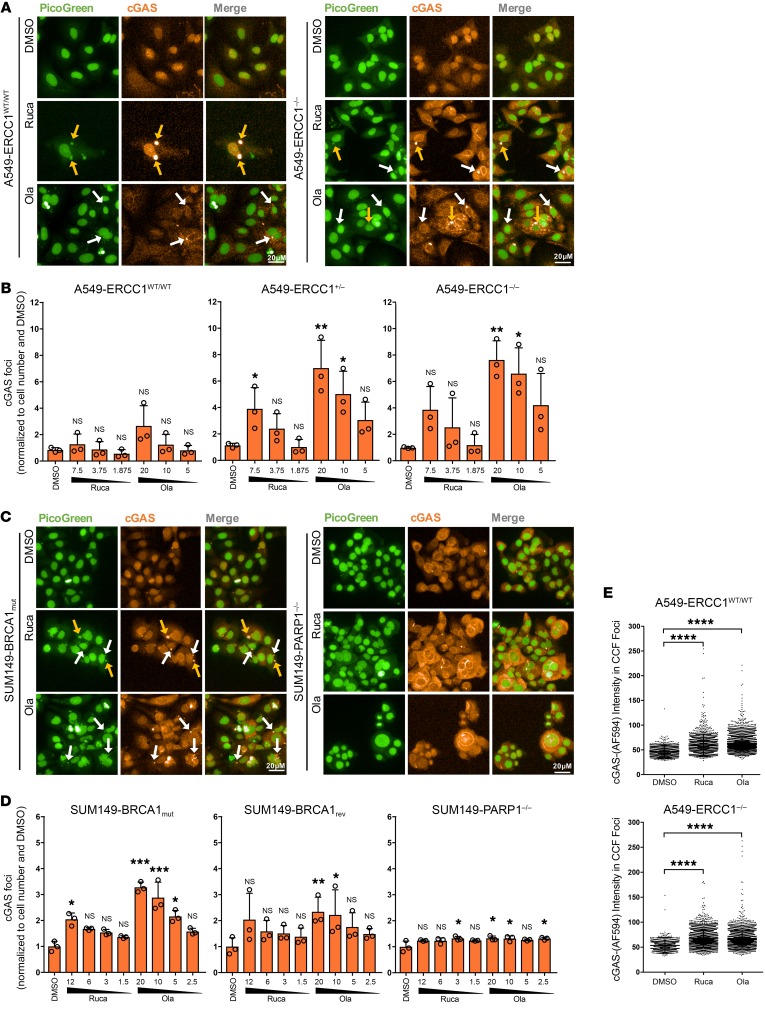
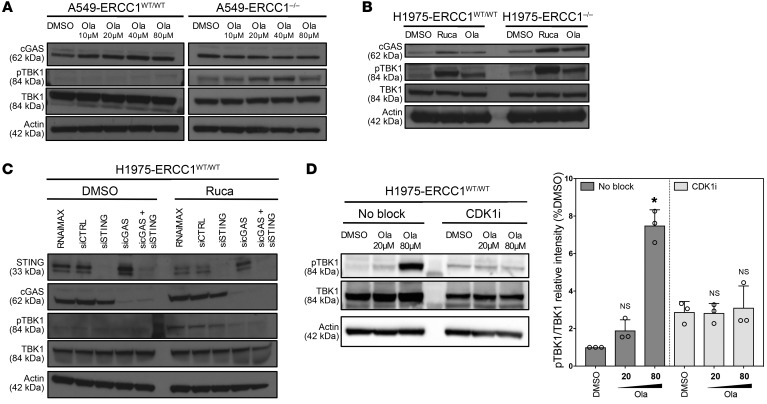
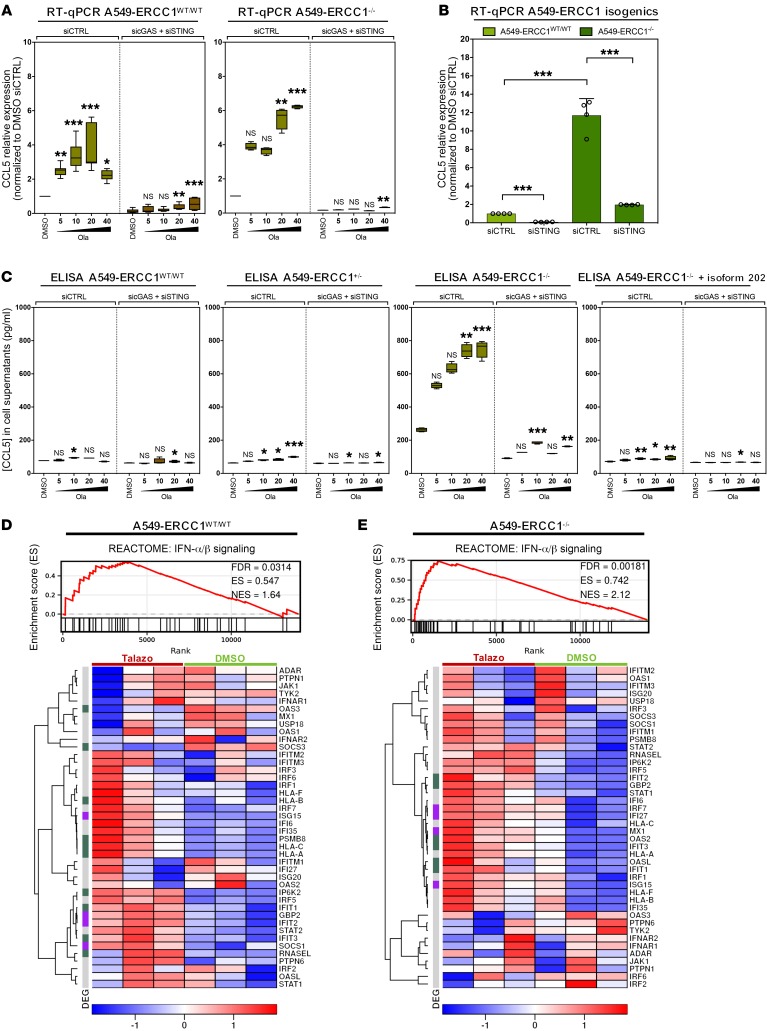
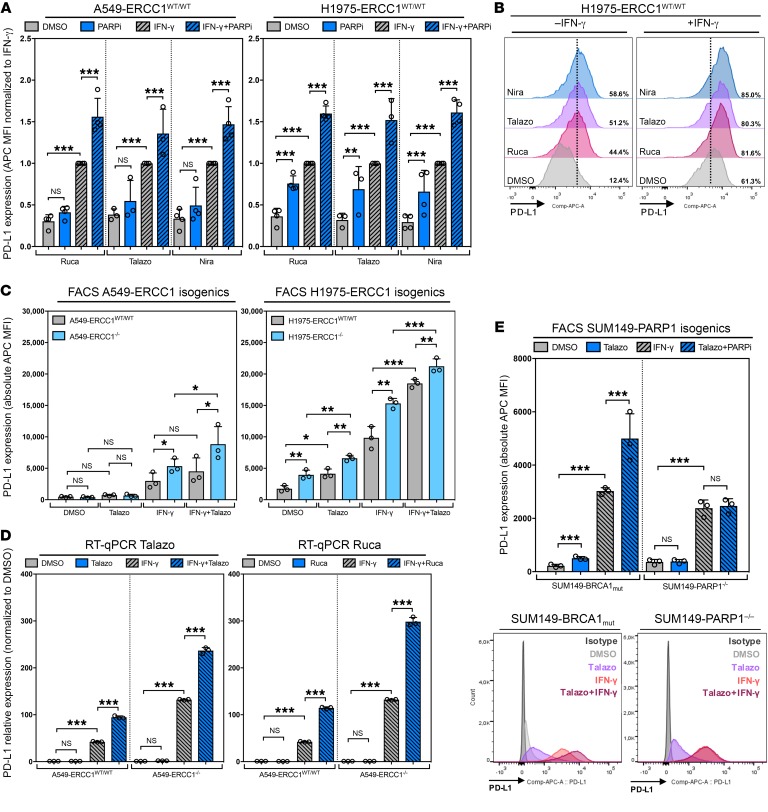
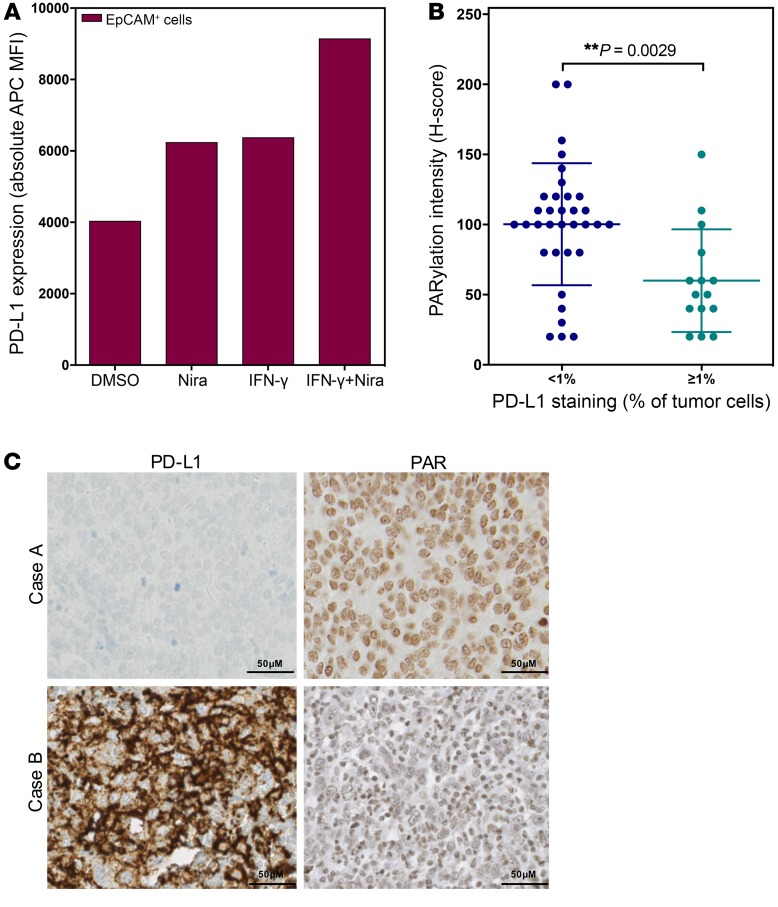
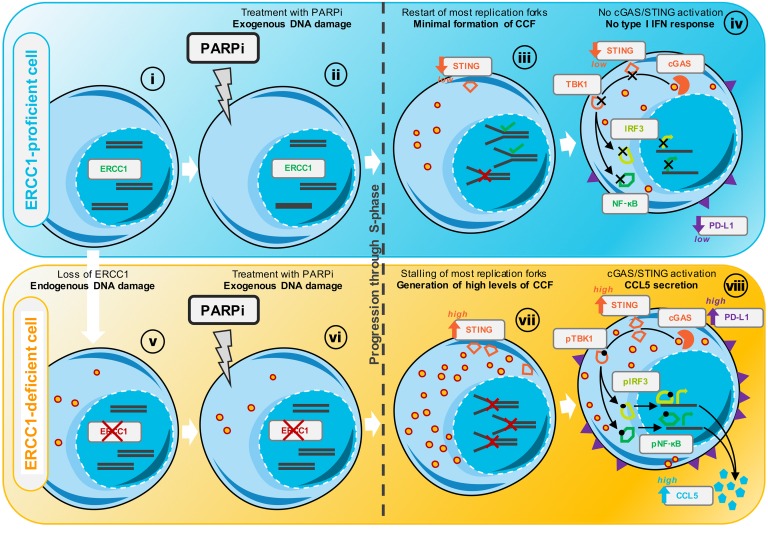
The cyclic GMP-AMP synthase/stimulator of IFN genes (cGAS/STING) pathway detects cytosolic DNA to activate innate immune responses. Poly(ADP-ribose) polymerase inhibitors (PARPi) selectively target cancer cells with DNA repair deficiencies such as those caused by BRCA1 mutations or ERCC1 defects. Using isogenic cell lines and patient-derived samples, we showed that ERCC1-defective non-small cell lung cancer (NSCLC) cells exhibit an enhanced type I IFN transcriptomic signature and that low ERCC1 expression correlates with increased lymphocytic infiltration. We demonstrated that clinical PARPi, including olaparib and rucaparib, have cell-autonomous immunomodulatory properties in ERCC1-defective NSCLC and BRCA1-defective triple-negative breast cancer (TNBC) cells. Mechanistically, PARPi generated cytoplasmic chromatin fragments with characteristics of micronuclei; these were found to activate cGAS/STING, downstream type I IFN signaling, and CCL5 secretion. Importantly, these effects were suppressed in PARP1-null TNBC cells, suggesting that this phenotype resulted from an on-target effect of PARPi on PARP1. PARPi also potentiated IFN-γ-induced PD-L1 expression in NSCLC cell lines and in fresh patient tumor cells; this effect was enhanced in ERCC1-deficient contexts. Our data provide a preclinical rationale for using PARPi as immunomodulatory agents in appropriately molecularly selected populations.

Keywords: Cellular immune response; DNA repair; Lung cancer; Oncology.


Conflict of interest statement

Conflict of interest: SPV has received research funding from Merck KGaA for an unrelated project, as part of the funding for her research team. AA, CJL, and ANJT are named inventors on patents (US patent nos. 9611223, 8143241) describing the use of PARPi and stand to gain from their use as part of the Institute of the Cancer Research “Rewards to Inventor” scheme. JCS has been a full-time employee of Medimmune/AstraZeneca since September 2017. He has received consultancy fees from AstraZeneca, Roche, Sanofi, Servier, and Pierre Fabre. AM has received consultancy fees and honoraria from Roche/Genentech, Pfizer, Novartis, Lytix Biopharma, Bristol-Myers Squibb, and MSD.

Figures

Figure 1
Figure 1. Loss of ERCC1 results in increased type I IFN and cytokine signaling in NSCLC models in vitro.
(A) Schematic of the generation of ERCC1-deficient clones from the parental NSCLC cell line A549. Full procedures are detailed in Friboulet et al. (31). (B) Western blot showing expression of ERCC1 in the parental (ERCC1WT/WT), heterozygous (ERCC1+/–), and ERCC1-knockout clones (c216, c295, and c375). (C) Heatmap displaying all significantly differentially expressed genes (significantly DEGs) in A549-ERCC1–/– cells compared with A549-ERCC1WT/WT cells, determined by RNA-Seq. n = 3; heatmap scale is a Z score. Threshold for differential expression was |LFC| > 1, and threshold for significance was FDR < 0.05. (D) GSEA of REACTOME pathways in A549-ERCC1–/– compared with A549-ERCC1WT/WT cells. Red, top 10 upregulated REACTOME pathways in A549-ERCC1–/– cells; yellow, top 10 downregulated REACTOME pathways in A549-ERCC1–/– cells. All pathways displayed had FDR < 0.05. AP folding*, antigen presentation folding assembly; Processing of capped intron*, processing of capped intron containing pre-mRNA; Interactions between a lymphoid cell and others*, interaction between a lymphoid cell and non-lymphoid cells. (E) GSEA of the REACTOME pathway “IFN-α/β signaling,” and associated heatmap showing the genes of the pathway, ranked by FDR. n = 3; heatmap scale is a Z score. (F) GSEA of the REACTOME pathway “Cytokine signaling in immune system,” and associated heatmap showing the genes of the pathway, ranked by FDR. n = 3; heatmap scale is a Z score. In E and F, purple, significantly DEGs with FDR < 0.05 and |LFC| > 1; gray, nonsignificantly DEGs.
Figure 2
Figure 2. Loss of ERCC1 associates with increased STING expression in vitro and enhanced lymphocytic infiltration in human NSCLC samples.
(A) Western blot illustrating ERCC1 and STING expression in A549-ERCC1WT/WT, A549-ERCC1+/–, A549-ERCC1–/– and A549-ERCC1–/– + isoform 202 isogenic cell lines. (B) Scatter box plots of ERCC1 protein expression (assessed by IHC staining) and the percentage of TILs (assessed through morphology) in a series of resected human NSCLC adenocarcinoma samples (n = 55). Tumors were classified according to the expression of ERCC1, and the corresponding level of TILs was plotted for each individual tumor. Mann-Whitney U test. (C) Representative images of ERCC1 and H&E stainings in 2 surgical specimens of resected lung adenocarcinoma. Case A shows low ERCC1 staining in tumor cells and high stromal TIL density; case B shows high ERCC1 staining in tumor cells and low stromal TIL density. Scale bars: 50 μm.
Figure 3
Figure 3. PARPi generate CCFs in an ERCC1-dependent manner in NSCLC cells.
(A) Assessment of olaparib (Ola) cytotoxicity in A549-ERCC1WT/WT versus A549-ERCC1+/–, A549-ERCC1–/–, and A549-ERCC1–/– + isoform 202 cell lines. Cells were treated with a range of doses of Ola and continuously exposed to the drug for 5 days. Shown are dose-response curves showing surviving fractions; mean ± SD, n = 4. (B) Representative immunofluorescence images of DMSO-, rucaparib- (Ruca-), and Ola-exposed A549-ERCC1WT/WT and A549-ERCC1–/– cells. Cells were exposed to 15 μM Ruca or 40 μM Ola during 72 hours. White arrows, CCFs; yellow arrows, micronuclei. Scale bar: 20 μm. (C) Automated quantification of CCFs in A549-ERCC1 isogenic cells exposed to increasing doses of Ruca or Ola (μM). Shown is CCF number per cell normalized to DMSO. Mean ± SD, n = 3; *P < 0.05, **P < 0.01, Kruskal-Wallis test and post hoc Dunn’s test, relative to DMSO control. Results shown are representative of 2 experiments performed with similar results.
Figure 4
Figure 4. PARPi generate CCFs in a DNA repair defect– and cell cycle-dependent manner.
(A) Schematic of the generation of BRCA1-revertant and PARP1-knockout cell lines from the parental BRCA1-mutant SUM149 TNBC cell line. (B) Representative immunofluorescence images of DMSO-, Ruca-, and Ola-exposed SUM149-BRCA1mut and SUM149-PARP1–/– cells. Cells were exposed to 6 μM Ruca, 10 μM Ola, or DMSO (vehicle) during 72 hours. White arrows, CCFs; yellow arrows, micronuclei. Scale bars: 20 μm. (C) Automated quantification of CCFs in SUM149-BRCA1mut, SUM149-BRCA1rev, and SUM149-PARP1–/– cells exposed to increasing doses of Ruca or Ola (μM). Shown is CCF number per cell normalized to DMSO. Mean ± SD, n = 3, Kruskal-Wallis test and post hoc Dunn’s test, relative to DMSO control. Results shown are representative of 2 experiments performed with similar results. (D) Western blot of histone H3 in the nuclear and cytoplasmic fractions of SUM149-BRCA1mut and SUM149-PARP1–/– cells exposed to PARPi during 48 hours. β-Tubulin and lamin B1 were used as fraction purity controls. (E and F) Automated quantification of CCFs in A549-ERCC1WT/WT (E) and SUM149-BRCA1mut (F) cells exposed to increasing doses of Ruca or Ola (μM) in the presence or absence of the cell cycle blocker CDK1i RO-3306. Shown is CCF number per cell normalized to DMSO. Mean ± SD, n = 3, Kruskal-Wallis test and post hoc Dunn’s test, relative to DMSO control. *P < 0.05, **P < 0.01, ***P < 0.001.
Figure 5
Figure 5. PARPi-induced CCFs are detected by cGAS.
(A) Representative immunofluorescence images of DMSO-, Ruca-, and Ola-exposed A549-ERCC1WT/WT and A549-ERCC1–/– cells. Cells were exposed to 15 μM Ruca or 40 μM Ola during 72 hours. White arrows, CCFs; yellow arrows, micronuclei. Scale bars: 20 μm. Images corresponding to the DMSO condition originate from the same image field as those shown in Figure 3B. (B) Automated quantification of cytoplasmic cGAS foci in A549-ERCC1 isogenic cells exposed to increasing doses of Ruca or Ola (μM). Shown are numbers of cytoplasmic cGAS foci per cell normalized to DMSO. Mean ± SD, n = 3, Kruskal-Wallis test and post hoc Dunn’s test, relative to DMSO control. Results shown are representative of 2 experiments performed with similar results. (C) Representative immunofluorescence images of DMSO-, Ruca-, and Ola-exposed SUM149-BRCA1mut and SUM149-PARP1–/– cells. Cells were exposed to 6 μM Ruca, 10 μM Ola, or DMSO (vehicle) during 72 hours. White arrows, CCFs; yellow arrows, micronuclei. Scale bars: 20 μm. (D) Automated quantification of cytoplasmic cGAS foci in SUM149-BRCA1mut, SUM149-BRCA1rev, and SUM149-PARP1–/– cells exposed to increasing doses of Ruca or Ola (μM). Shown are numbers of cytoplasmic cGAS foci per cell normalized to DMSO. Mean ± SD, n = 3; Kruskal-Wallis test and post hoc Dunn’s test, relative to DMSO control. Results shown are representative of 2 experiments performed, with similar results. (E) Scatter box plots displaying cGAS foci intensity for each colocalizing CCF foci in A549-ERCC1WT/WT and A549-ERCC1–/– cells exposed to DMSO (vehicle), 15 μM Ruca, or 40 μM Ola. n = 3, Kruskal-Wallis test and post hoc Dunn’s test. *P < 0.05, **P < 0.01, ***P < 0.001, ****P < 0.0001.
Figure 6
Figure 6. cGAS-mediated detection of PARPi-induced CCFs activates STING signaling in an ERCC1-dependent manner.
(A and B) Western blot of pTBK1 in A549-ERCC1WT/WT and A549-ERCC1–/– cells (A) or H1975-ERCC1WT/WT and H1975-ERCC1–/– cells (B) upon PARPi exposure. Cells were exposed for 48 hours to DMSO (vehicle) and a range of doses of Ola (A), or DMSO, 25 μM Ruca, and 40 μM Ola (B). Lysates were probed with the indicated antibodies. (C) Western blot of pTBK1 in DMSO- or Ruca-treated H1975-ERCC1WT/WT cells in the context of siRNA silencing of cGAS/STING. Cells were transfected with RNAiMAX (Thermo Fisher Scientific), siCTRL, siSTING, sicGAS, or siSTING + sicGAS and exposed to DMSO (vehicle) or 25 μM Ruca, and lysates were probed with the indicated antibodies. (D) Western blot of pTBK1 in DMSO- or Ola-treated H1975-ERCC1WT/WT cells upon cell cycle blockade. Cells were exposed to DMSO or 20 μM or 80 μM Ola in the presence or absence of the cell cycle blocker CDK1i RO-3306. Lysates were probed with the indicated antibodies. Graph: pTBK1/TBK1 intensity was measured for each condition and normalized to DMSO. Mean ± SD, n = 3; *P < 0.05, Kruskal-Wallis test and post hoc Dunn’s test, relative to DMSO control.
Figure 7
Figure 7. PARPi induce secretion of the chemotactic chemokine CCL5 in a cGAS/STING-dependent manner, and activate type I IFN signaling.
(A) RT-qPCR analysis of RNA isolated from Ola-exposed A549-ERCC1WT/WT and A549-ERCC1–/– cells, in the presence or absence of cGAS/STING silencing by siRNA. Cells were transfected with siCTRL or sicGAS + siSTING and treated for 72 hours with DMSO or a range of doses of Ola (μM). CCL5 mRNAs were analyzed relative to GAPDH. Box-and-whisker plots show arbitrary units of gene expression, normalized to DMSO-treated control. Boxes indicate median and lower and upper quartiles; whiskers indicate the 5th to 95th percentile range; n = 12, Kruskal-Wallis test and post hoc Dunn’s test, relative to DMSO control. (B) RT-qPCR analysis of RNA isolated from A549-ERCC1WT/WT and A549-ERCC1–/– cells, in the presence or absence of cGAS/STING silencing by siRNA. Cells were transfected with siCTRL or sicGAS + siSTING. CCL5 mRNAs were analyzed relative to GAPDH. Shown are arbitrary units of gene expression, normalized to A549-ERCC1WT/WT DMSO-treated control. Mean ± SD, n = 4, 2-way ANOVA. (C) Quantitative analysis of CCL5 secretion in A549-ERCC1 isogenic cell supernatants upon Ola exposure, in the presence or absence of cGAS/STING silencing by siRNA. Cells were transfected with siCTRL or sicGAS + siSTING and treated for 72 hours with DMSO or a dose range of Ola (μM). Supernatants were collected and analyzed by ELISA for detection of CCL5. Box-and-whisker plots show CCL5 concentrations. Boxes indicate median and lower and upper quartiles; whiskers indicate the 5th to 95th percentile range; n = 4, Kruskal-Wallis test and post hoc Dunn’s test, relative to DMSO control. (D and E) GSEA of the REACTOME pathway “IFN-α/β signaling” in talazoparib- (Talazo-) versus DMSO-treated A549-ERCC1WT/WT cells (D) or A549-ERCC1–/– cells (E). A heatmap showing the genes of the pathway is shown below. n = 3; heatmap scale is a Z score. Purple, significantly DEGs with FDR < 0.05 and |LFC| > 1; green, significantly DEGs with FDR < 0.05 and |LFC| > 0.58; gray, nonsignificantly DEGs.*P < 0.05, **P < 0.01, ***P < 0.001.
Figure 8
Figure 8. ERCC1 deficiency and PARPi exposure potentiate IFN-γ–induced cell-surface PD-L1 expression.
(A) Quantification of PD-L1 cell surface expression by flow cytometry in H1975-ERCC1WT/WT and A549-ERCC1WT/WT cells upon PARPi and IFN-γ exposure. Cells were treated for 48 hours with DMSO, 15 μM Ruca, 3 μM Talazo, 10 μM niraparib (Nira), and/or 500 U/ml IFN-γ. MFI ± SD normalized to IFN-γ; n = 4, 2-way ANOVA and post hoc Tukey’s test. (B) Corresponding flow cytometry histograms; shown is the percentage of PD-L1–positive cells. (C) Quantification of PD-L1 cell surface expression by flow cytometry in A549-ERCC1WT/WT, A549-ERCC1–/–, H1975-ERCC1WT/WT, and H1975-ERCC1–/– cells treated for 48 hours with DMSO, 3 μM Talazo, and/or 500 U/ml IFN-γ. MFI ± SD, 2-way ANOVA and post hoc Tukey’s test. (D) RT-qPCR analysis of RNA isolated from A549-ERCC1WT/WT and A549-ERCC1–/– cells exposed to PARPi and/or IFN-γ. Cells were treated for 48 hours with DMSO, 3 μM Talazo, or 13.5 μM Ruca, and/or 500 U/ml IFN-γ. PD-L1 mRNAs were analyzed relative to GAPDH (to control for cDNA quantity). Shown are arbitrary units of gene expression, normalized to A549-ERCC1WT/WT DMSO-treated control. Mean ± SD, n = 3, 2-way ANOVA and post hoc Tukey’s test. (E) Quantification of PD-L1 cell surface expression by flow cytometry in SUM149-BRCA1mut and SUM149-PARP1–/– cells treated for 48 hours with DMSO, 3 μM Talazo, and/or 500 U/ml IFN-γ. MFI ± SD, n = 3, 2-way ANOVA and post hoc Tukey’s test. Corresponding flow cytometry histograms are shown at the bottom. *P < 0.05, **P < 0.01, ***P < 0.001.
Figure 9
Figure 9. PARPi induce PD-L1 expression in patient-derived NSCLC cells and high PD-L1 expression associates with low PARylation in human NSCLC samples.
(A) Quantification of PD-L1 cell surface expression by flow cytometry in the EpCAM-positive cells of a pleural effusion sample upon PARPi and/or IFN-γ exposure. Cells were treated in vitro for 48 hours with DMSO or 10 μM Nira, 500 U/ml IFN-γ, or both. MFI of a single staining is shown. (B) Scatter box plot showing PARylation levels and tumor cell expression of PD-L1 (as assessed by IHC staining) in a series of resected stage I/II NSCLC (invasive adenocarcinomas and squamous cell carcinomas) samples (n = 49). Mann-Whitney U test. (C) Representative images of PAR and PD-L1 IHC stainings in surgical specimens of NSCLC. Case A shows low PD-L1 staining in tumor cells and high PARylation levels; case B shows high PD-L1 staining in tumor cells and low PARylation levels. Scale bars: 50 μm.
Figure 10
Figure 10. Model of ERCC1 defect-dependent activation of cGAS/STING following PARPi exposure.
(i) ERCC1WT/WT cells have a functional DDR and adequately maintain genome integrity. (ii) Upon PARPi exposure, exogenous DNA damage is triggered, mostly initiated by PARP1 itself trapped onto the DNA at sites of spontaneous single-strand breaks (SSBs). (iii) During the S phase of the cell cycle, trapped PARP1 generates lesions that prevent the progression of replication forks, leading to fork stalling and subsequent formation of DSBs. In ERCC1WT/WT cells, most trapped PARP1 lesions are removed, which enables the processing of DSBs through HR and eventually allows replication to restart. Residual inadequately repaired lesions cause moderate formation of CCFs. (iv) The low levels of CCFs generated are unable to trigger the pTBK1/IRF3/NF-κB signaling cascade or subsequent transcription of type I IFN genes; PD-L1 is moderately induced. (v) ERCC1–/– cells are exposed to increased endogenous DNA damage following the loss of ERCC1. This generates minimal levels of CCFs. (vi) Upon PARPi exposure, ERCC1–/– cells are subjected to an additional exogenous source of DNA damage. (vii) During the S phase of the cell cycle, trapped PARP1 generates lesions that prevent the progression of replication forks, leading to stalling of forks and subsequent formation of DSBs. In the absence of ERCC1, trapped PARP1 lesions cannot be adequately resolved, which triggers increased DSBs and eventually generates high levels of CCFs. (viii) CCFs are detected by cGAS and, due to the enhanced expression of STING in ERCC1–/– cells, these efficiently activate cGAS/STING signaling. Activated STING homodimer phosphorylates TBK1, which in turn phosphorylates IRF3 and NF-κB; this triggers their translocation into the nucleus and results in the transcription of type I IFN genes: CCL5 and other type I IFN cytokines are secreted. Higher PD-L1 expression is induced at the cell surface.

References

    1. Gandhi L, et al. Pembrolizumab plus chemotherapy in metastatic non-small-cell lung cancer. N Engl J Med. 2018;378(22):2078–2092. doi: 10.1056/NEJMoa1801005. - DOI - PubMed
    1. Hellmann MD, et al. Nivolumab plus ipilimumab in lung cancer with a high tumor mutational burden. N Engl J Med. 2018;378(22):2093–2104. doi: 10.1056/NEJMoa1801946. - DOI - PMC - PubMed
    1. Gettinger S, et al. Five-year follow-up of nivolumab in previously treated advanced non-small-cell lung cancer: results from the CA209-003 Study. J Clin Oncol. 2018;36(17):1675–1684. doi: 10.1200/JCO.2017.77.0412. - DOI - PubMed
    1. Fruh M, Peters S. Genomic features of response to combination immunotherapy in lung cancer. Cancer Cell. 2018;33(5):791–793. doi: 10.1016/j.ccell.2018.04.005. - DOI - PubMed
    1. Chabanon RM, Pedrero M, Lefebvre C, Marabelle A, Soria JC, Postel-Vinay S. Mutational landscape and sensitivity to immune checkpoint blockers. Clin Cancer Res. 2016;22(17):4309–4321. doi: 10.1158/1078-0432.CCR-16-0903. - DOI - PubMed

Publication types

MeSH terms