

The association between excise tax structures and the price variability of alcoholic beverages in the United States
- PMID: 30589849
- PMCID: PMC6307826
- DOI: 10.1371/journal.pone.0208509
The association between excise tax structures and the price variability of alcoholic beverages in the United States
Abstract
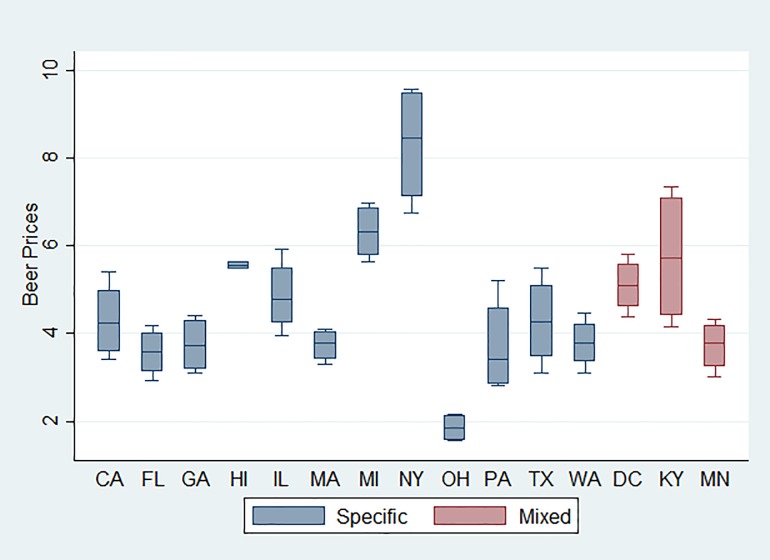
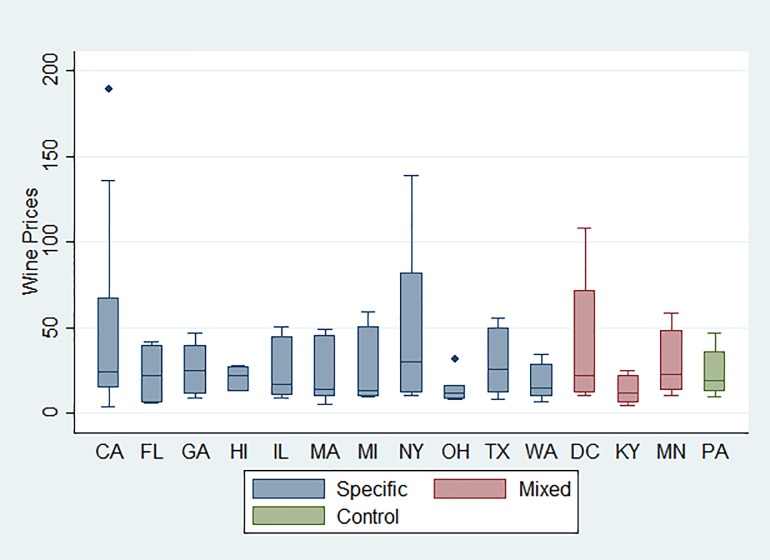
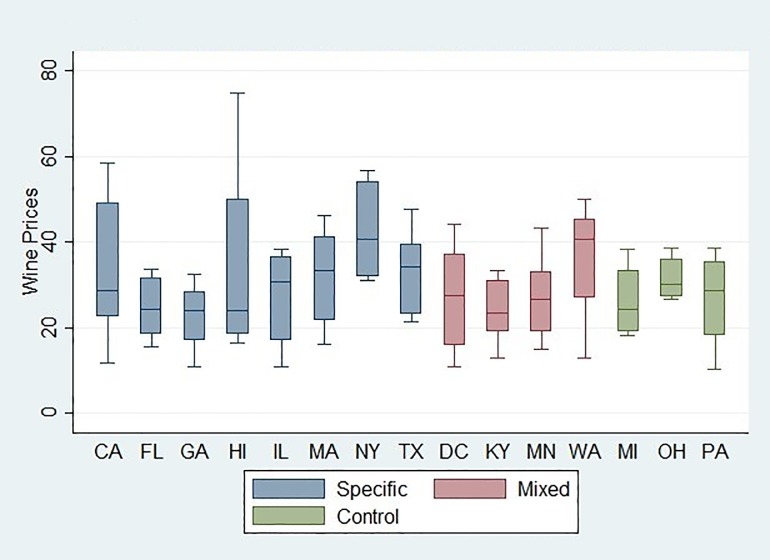
Recent tobacco taxation research suggests that excise tax structure plays an important role in the effectiveness of increasing taxes in reducing consumption. However, evidence on excise tax structures of alcoholic beverages is scarce. We linked price variability measures for beer, wine, and liquor in the US derived using Economist Intelligence Unit city data from 2003 to 2016 with state-level excise tax structures from the Alcohol Policy Information System. Ordinary least squares (OLS) regressions were performed to assess the associations between excise tax structures and price variability, for beer, wine, and liquor (spirits), respectively. Results suggest that, compared with a specific excise beer tax structure based on volumes, a mixed structure with both specific and ad valorem components was associated with 38% (p≤0.01) greater beer price variability. In addition, a mixed excise tax structure for liquor was associated with 60-77% (p≤0.01) greater liquor price variability. However, these associations do not imply a causal link between tax structures and price variability. In summary, a mixed excise tax structure is associated with greater variability in beer and liquor prices, an indicator for tax avoidance opportunities. Future research is needed to identify the causal impact of tax structures on price variability.
Conflict of interest statement
The authors have declared that no competing interests exist.
Figures
Similar articles
-
The pass-through of alcohol excise taxes to prices in OECD countries.Eur J Health Econ. 2020 Aug;21(6):855-867. doi: 10.1007/s10198-020-01177-w. Epub 2020 Mar 31. Eur J Health Econ. 2020. PMID: 32236765 Free PMC article.
-
Alcohol excise taxes as a percentage of retail alcohol prices in 26 OECD countries.Drug Alcohol Depend. 2021 Feb 1;219:108415. doi: 10.1016/j.drugalcdep.2020.108415. Epub 2020 Nov 24. Drug Alcohol Depend. 2021. PMID: 33307302 Free PMC article.
-
Erosion of State Alcohol Excise Taxes in the United States.J Stud Alcohol Drugs. 2018 Jan;79(1):43-48. doi: 10.15288/jsad.2018.79.43. J Stud Alcohol Drugs. 2018. PMID: 29227230 Free PMC article.
-
Health benefits of increases in alcohol and cigarette taxes.Br J Addict. 1989 Oct;84(10):1193-204. doi: 10.1111/j.1360-0443.1989.tb00715.x. Br J Addict. 1989. PMID: 2684304 Review.
-
Alcohol tax changes and the use of alcohol in Europe.Drug Alcohol Rev. 2011 Mar;30(2):124-9. doi: 10.1111/j.1465-3362.2010.00265.x. Drug Alcohol Rev. 2011. PMID: 21375612 Review.
Cited by
-
Introducing the PLOS special collection of economic cases for NCD prevention and control: A global perspective.PLoS One. 2020 Feb 6;15(2):e0228564. doi: 10.1371/journal.pone.0228564. eCollection 2020. PLoS One. 2020. PMID: 32027710 Free PMC article.
-
Recreational cannabis excise taxation in the USA: Constructing a comparable tax measure for empirical analysis.Int J Drug Policy. 2024 Dec;134:104630. doi: 10.1016/j.drugpo.2024.104630. Epub 2024 Nov 9. Int J Drug Policy. 2024. PMID: 39522235
-
The pass-through of alcohol excise taxes to prices in OECD countries.Eur J Health Econ. 2020 Aug;21(6):855-867. doi: 10.1007/s10198-020-01177-w. Epub 2020 Mar 31. Eur J Health Econ. 2020. PMID: 32236765 Free PMC article.
-
Alcohol excise taxes as a percentage of retail alcohol prices in 26 OECD countries.Drug Alcohol Depend. 2021 Feb 1;219:108415. doi: 10.1016/j.drugalcdep.2020.108415. Epub 2020 Nov 24. Drug Alcohol Depend. 2021. PMID: 33307302 Free PMC article.
References
Publication types
MeSH terms
Grants and funding
LinkOut - more resources
Full Text Sources
