Review
. 2018 Dec 27;14(12):e1007309.
doi: 10.1371/journal.pgen.1007309. eCollection 2018 Dec.

Population structure in genetic studies: Confounding factors and mixed models

Affiliations
Review

Population structure in genetic studies: Confounding factors and mixed models

Jae Hoon Sul et al. PLoS Genet. .

Abstract

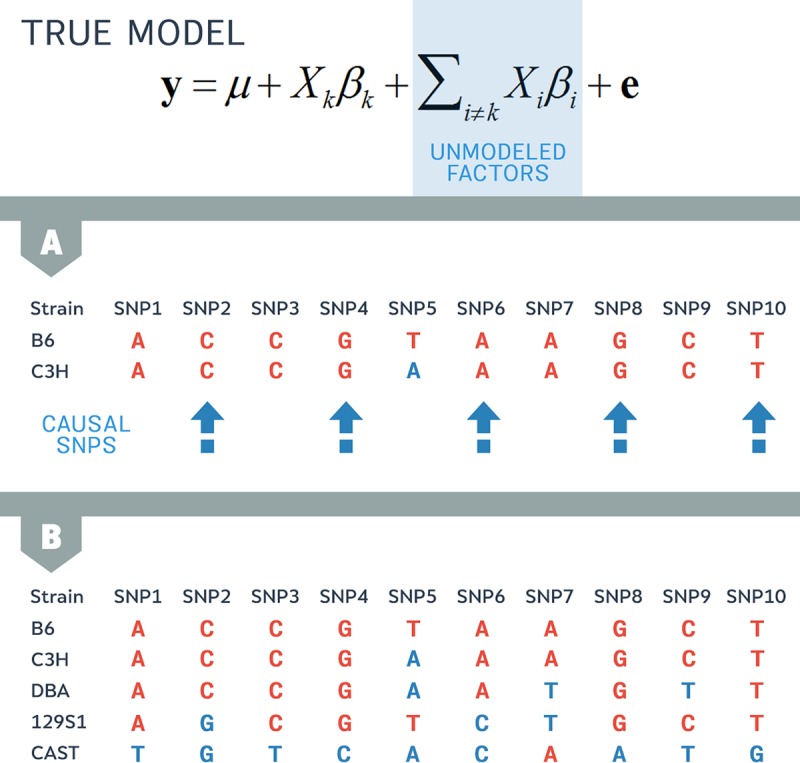
A genome-wide association study (GWAS) seeks to identify genetic variants that contribute to the development and progression of a specific disease. Over the past 10 years, new approaches using mixed models have emerged to mitigate the deleterious effects of population structure and relatedness in association studies. However, developing GWAS techniques to accurately test for association while correcting for population structure is a computational and statistical challenge. Using laboratory mouse strains as an example, our review characterizes the problem of population structure in association studies and describes how it can cause false positive associations. We then motivate mixed models in the context of unmodeled factors.


Conflict of interest statement

The authors have declared that no competing interests exist.

Figures

Fig 1
Fig 1. Standard genetic association study applied to human blood pressure data.
(A) The left SNP appears to be more strongly associated with blood pressure than the right SNP. (B) We test 2 hypotheses against each other to evaluate whether the association between an SNP and a phenotype is statistically significant. By default, a null hypothesis assumes that the SNP does not affect the phenotype. (C) If the data fit the alternative hypothesis beyond a certain threshold, the SNP is described as significantly associated with the phenotype. For simplicity, in the diagram, we are depicting only 1 chromosome per individual. BP, blood pressure; SNP, single nucleotide polymorphism.
Fig 2
Fig 2. Significance testing in association studies.
The null distribution is the standard normal distribution and the expected distribution of the association statistics under the assumption that the effect size is 0. Each variant’s association statistic in Eq 2 is computed, and its significance is evaluated using the null distribution. If the statistic falls in the significance region of the distribution, the variant is declared associated. In this example, S1 is not significant, whereas S2 and S3 are significant. The exact location of the threshold is defined as the location on the x-axis where the tail probability area equals the significance threshold (S). This is denoted using the quantile of the standard normal Φ-1x.
Fig 3
Fig 3. A phylogenetic tree demonstrating the relationships between 38 inbred mouse strains using 140,000 mouse HapMap SNPs.
As shown in the tree, the strains cluster in 2 groups: classical inbred strains and wild-derived strains. The body weight phenotypes, obtained from the Mouse Phenome Database, of the strains are shown. Here, classical inbred strains have much higher body weight than wild-derived strains. Many SNPs separate the 2 groups because of the long branch length. One such SNP is shown in the figure. Clearly the SNP is highly correlated with body weight. All of the SNPs that separate these 2 groups will have the same correlation. When we consider both the tree and the SNP, we can infer that the population structure may be driving this correlation and not an effect of the SNP on body weight. SNP, single nucleotide polymorphism.
Fig 4
Fig 4
Expected distribution of p-values in a typical (A) Manhattan plot, (B) cumulative p-value distribution, and (C) Q–Q plot. Circles in (B) and (C) denote where the median p-value (red line) falls on the graph in comparison to the expected median p-value (yellow line). Here, the median falls close to 0.5, suggesting that population structure is not affecting association results or has been corrected for in the model. Q–Q, quantile–quantile.
Fig 5
Fig 5
Observed distribution in a (A) Manhattan plot, (B) cumulative p-value distribution, and (C) Q–Q plot. Circles in (B) and (C) indicate where the median p-value falls on the plot compared to where it is expected. Here, there is a substantial deviation between the red and yellow lines due to inflation of false positive associations for the body weight phenotype. Q–Q, quantile–quantile.
Fig 6
Fig 6
(A) The SNP and the phenotype are independent under the null hypothesis (H0) and correlated under the alternative hypothesis (H1). (B) In the case of population structure, the structure will influence many SNPs and the phenotype. In this case, correlation between SNPs and the phenotype will be induced in both the null and alternate hypothesis. SNP, single nucleotide polymorphism.
Fig 7
Fig 7. Pairwise similarity between strains gives some insight into the similarity of the unmodeled factor.
In this toy example, we consider 10 SNPs in which the even-numbered SNPs are the causal SNPs with an effect on the trait. (A) Because B6 and C3H share alleles at 9 out of 10 SNPs, these strains have a similar value for the unmodeled factor. (B) When we consider other strains, the unmodeled factors may be larger. For example, B6 and CAST, which share few SNPs, will have different values for their unmodeled factor. SNP, single nucleotide polymorphism.
Fig 8
Fig 8. The mixed model includes a term u which attempts to model the unmodeled factors in the true model.
The term uses information from the kinship matrix that accounts for the dependency among SNPs correlated with phenotypes due to population structure. SNP, single nucleotide polymorphism.
Fig 9
Fig 9
(A) The conventional GWAS test applied to mouse body weight phenotypes produces numerous false positives. (B) The mixed model approach using EMMA almost completely reduces the inflation of false positives and identifies a strong peak (chr8) that falls into a known body weight QTL. chr8, chromosome 8; EMMA, efficient mixed model association; GWAS, genome-wide association study; QTL, quantitative trait loci.
Fig 10
Fig 10
(A) The conventional GWAS test applied to mouse liver weight phenotypes produces numerous false positive associations. (B) The mixed model approach using EMMA reduces inflation of false positives and correctly produces a stronger signal at chr2, a region that is located in known QTLs for liver weight. chr2, chromosome 2; EMMA, efficient mixed model association; GWAS, genome-wide association study; QTL, quantitative trait loci.
Fig 11
Fig 11. Different degrees of relatedness in the sample.
(A) All of the individuals in a genetic study are somehow related through a large pedigree or family tree. Different parts of the tree induce different types of relatedness. (B) Cryptic relatedness refers to relatively recent genetic relationships. (C) Relatedness due to ancestry refers to relatedness caused by ancestors originating from the same region. The boxes in (B) and (C) represent the level of the pedigree that causes that type of relatedness in each case, respectively.

References

    1. Manolio TA, Collins FS, Cox NJ, Goldstein DB, Hindorff LA, Hunter DJ, et al. Finding the missing heritability of complex diseases. Nature. 2009;461(7265):747–53. Epub 2009/10/09. 10.1038/nature08494 - DOI - PMC - PubMed
    1. International Schizophrenia C, Purcell SM, Wray NR, Stone JL, Visscher PM, O'Donovan MC, et al. Common polygenic variation contributes to risk of schizophrenia and bipolar disorder. Nature. 2009;460(7256):748–52. Epub 2009/07/03. 10.1038/nature08185 - DOI - PMC - PubMed
    1. Stram DO. Design, analysis, and interpretation of genome-wide association scans. New York: Springer; 2014. xv, 334 pages p.
    1. Yang J, Benyamin B, McEvoy BP, Gordon S, Henders AK, Nyholt DR, et al. Common SNPs explain a large proportion of the heritability for human height. Nat Genet. 2010;42(7):565–9. Epub 2010/06/22. 10.1038/ng.608 - DOI - PMC - PubMed
    1. MacArthur J, Bowler E, Cerezo M, Gil L, Hall P, Hastings E, et al. The new NHGRI-EBI Catalog of published genome-wide association studies (GWAS Catalog). Nucleic Acids Res. 2017;45(D1):D896–D901. Epub 2016/12/03. 10.1093/nar/gkw1133 - DOI - PMC - PubMed

Publication types