

Cardiovascular sexual dimorphism in a diet-induced type 2 diabetes rodent model, the Nile rat (Arvicanthis niloticus)
- PMID: 30589871
- PMCID: PMC6307866
- DOI: 10.1371/journal.pone.0208987
Cardiovascular sexual dimorphism in a diet-induced type 2 diabetes rodent model, the Nile rat (Arvicanthis niloticus)
Abstract
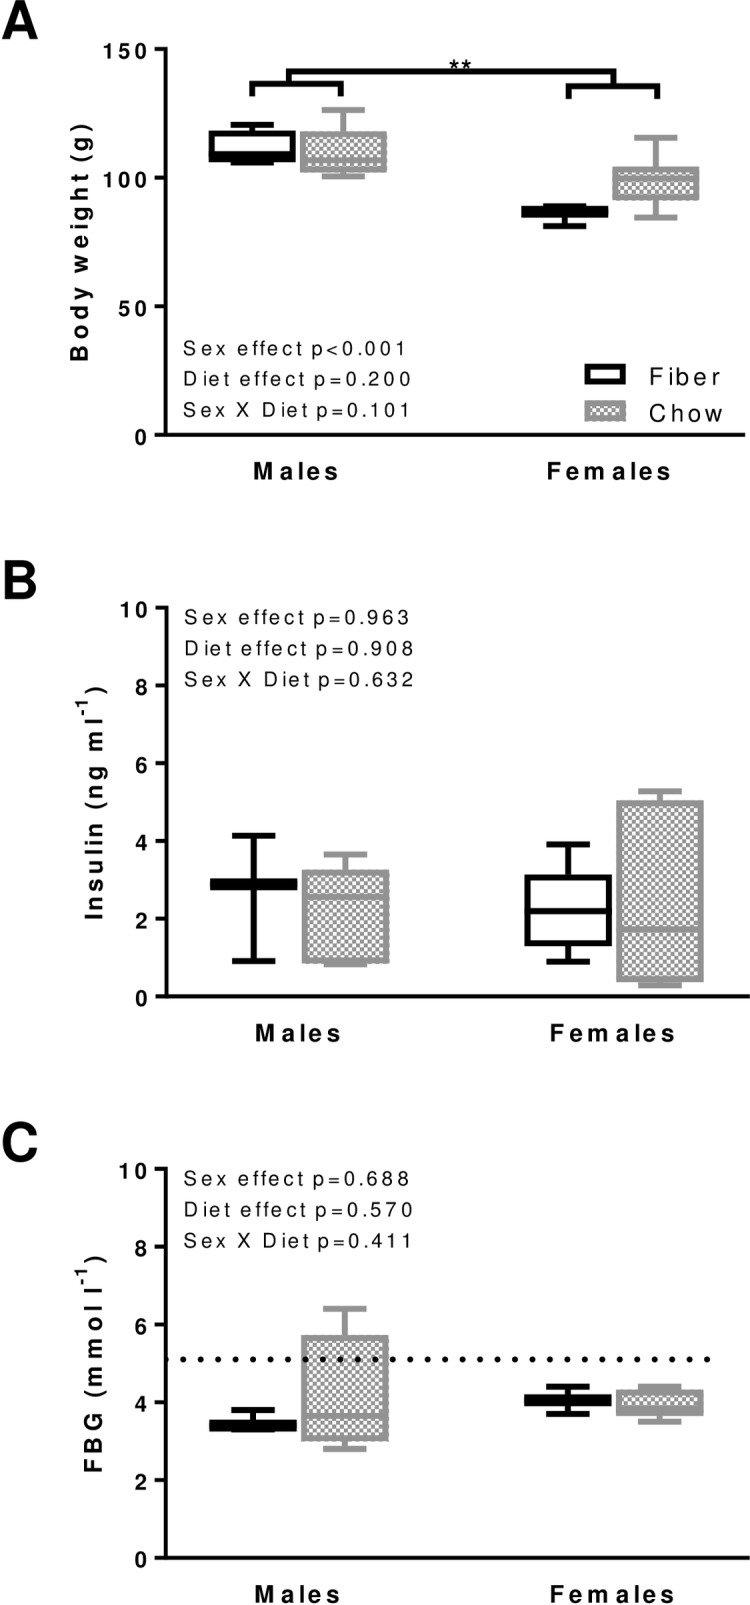
Background: The Nile rat (Arvicanthis niloticus) is an emerging laboratory model of type 2 diabetes. When fed standard rodent chow, the majority of males progress from hyperinsulinemia by 2 months to hyperglycemia by 6 months, while most females remain at the hyperinsulinemia-only stage (prediabetic) from 2 months onward. Since diabetic cardiomyopathy is the major cause of type-2 diabetes mellitus (T2DM)-related mortality, we examined whether sexual dimorphism might entail cardiac functional changes. Our ultimate goal was to isolate the effect of diet as a modifiable lifestyle factor.
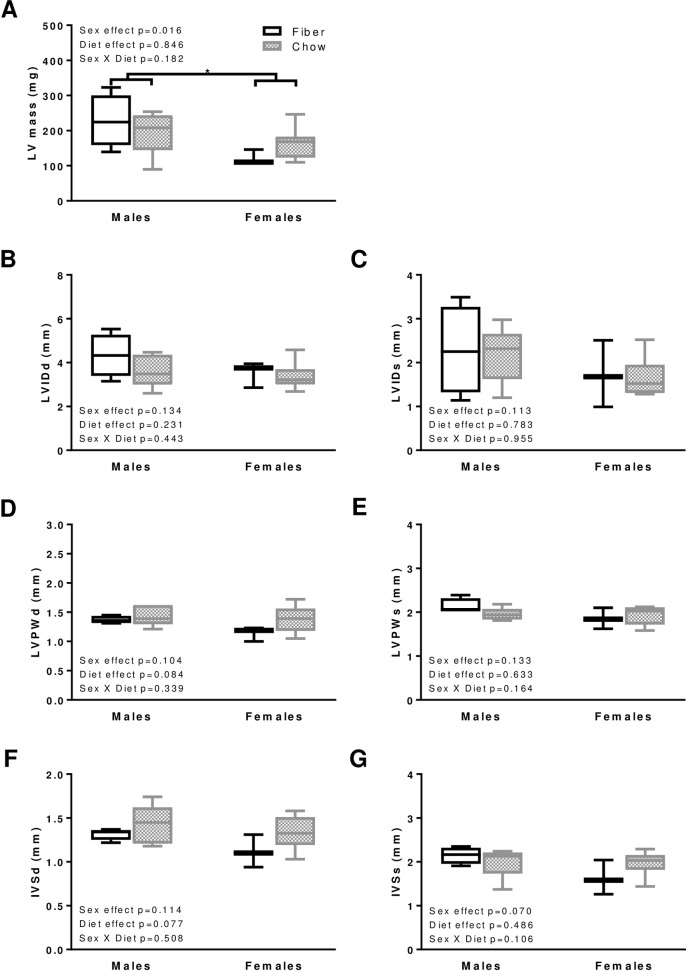
Materials and methods: Nile rats were fed either standard rodent chow (Chow group) or a high-fiber diet previously established to prevent type 2 diabetes (Fiber group). Cardiac function was determined with echocardiography at 12 months of age. To isolate the effect of diet alone, only the small subset of animals resistant to both hyperinsulinemia and hyperglycemia were included in this study.
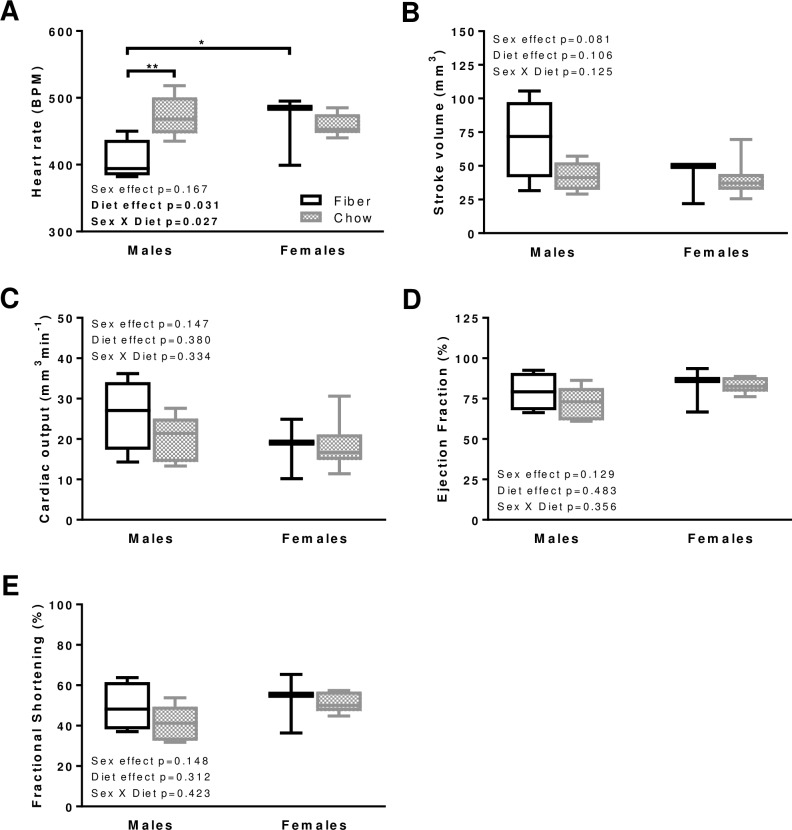
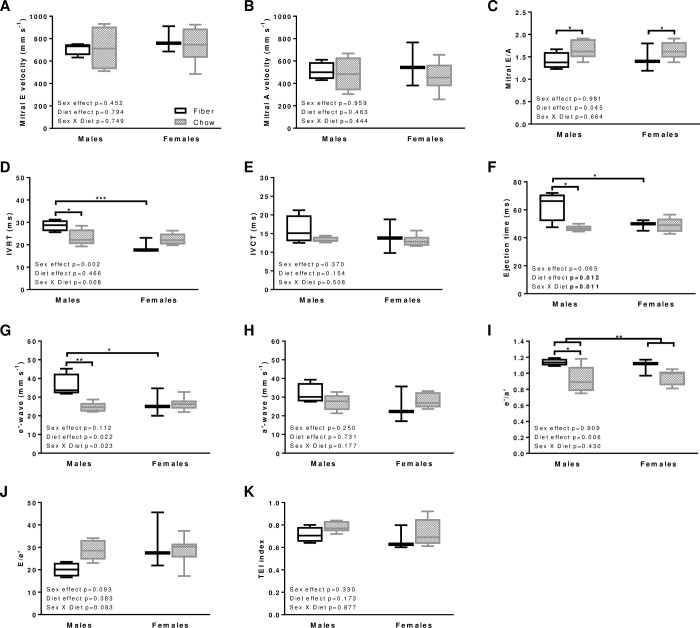
Results: In males, Chow (compared to Fiber) was associated with elevated heart rate and mitral E/A velocity ratio, and with lower e'-wave velocity, isovolumetric relaxation time, and ejection time. Of note, these clinically atypical types of diastolic dysfunction occurred independently of body weight. In contrast, females did not exhibit changes in cardiovascular function between diets.
Conclusions: The higher prevalence of T2DM in males correlates with their susceptibility to develop subtle diastolic cardiac dysfunction when fed a Western style diet (throughout most of their lifespan) despite no systemic evidence of metabolic syndrome, let alone T2DM.
Conflict of interest statement
The authors have declared that no competing interests exist.
Figures
Similar articles
-
Genetic Permissiveness and Dietary Glycemic Load Interact to Predict Type-II Diabetes in the Nile rat (Arvicanthis niloticus).Nutrients. 2019 Jul 6;11(7):1538. doi: 10.3390/nu11071538. Nutrients. 2019. PMID: 31284621 Free PMC article.
-
Age and sex as confounding factors in the relationship between cardiac mitochondrial function and type 2 diabetes in the Nile Grass rat.PLoS One. 2020 Feb 21;15(2):e0228710. doi: 10.1371/journal.pone.0228710. eCollection 2020. PLoS One. 2020. PMID: 32084168 Free PMC article.
-
Nutritional correlates and dynamics of diabetes in the Nile rat (Arvicanthis niloticus): a novel model for diet-induced type 2 diabetes and the metabolic syndrome.Nutr Metab (Lond). 2010 Apr 15;7:29. doi: 10.1186/1743-7075-7-29. Nutr Metab (Lond). 2010. PMID: 20398338 Free PMC article.
-
Five stages of progressive β-cell dysfunction in the laboratory Nile rat model of type 2 diabetes.J Endocrinol. 2016 Jun;229(3):343-56. doi: 10.1530/JOE-15-0517. Epub 2016 Apr 11. J Endocrinol. 2016. PMID: 27068697
-
The Nile Rat (Arvicanthis niloticus) as a Superior Carbohydrate-Sensitive Model for Type 2 Diabetes Mellitus (T2DM).Nutrients. 2018 Feb 18;10(2):235. doi: 10.3390/nu10020235. Nutrients. 2018. PMID: 29463026 Free PMC article. Review.
Cited by
-
Insulin and circadian rhythm genes of the Nile rat (Arvicanthis niloticus) are conserved and orthologous to those in the rat, mouse and human.Genetica. 2024 Feb;152(1):11-29. doi: 10.1007/s10709-023-00202-z. Epub 2023 Dec 15. Genetica. 2024. PMID: 38099985
-
Genetic Permissiveness and Dietary Glycemic Load Interact to Predict Type-II Diabetes in the Nile rat (Arvicanthis niloticus).Nutrients. 2019 Jul 6;11(7):1538. doi: 10.3390/nu11071538. Nutrients. 2019. PMID: 31284621 Free PMC article.
-
Plasma metabolomics supports non-fasted sampling for metabolic profiling across a spectrum of glucose tolerance in the Nile rat model for type 2 diabetes.Lab Anim (NY). 2023 Nov;52(11):269-277. doi: 10.1038/s41684-023-01268-0. Epub 2023 Oct 19. Lab Anim (NY). 2023. PMID: 37857753 Free PMC article.
-
Palm Fruit Bioactives augment expression of Tyrosine Hydroxylase in the Nile Grass Rat basal ganglia and alter the colonic microbiome.Sci Rep. 2019 Dec 9;9(1):18625. doi: 10.1038/s41598-019-54461-y. Sci Rep. 2019. PMID: 31819070 Free PMC article.
-
Age and sex as confounding factors in the relationship between cardiac mitochondrial function and type 2 diabetes in the Nile Grass rat.PLoS One. 2020 Feb 21;15(2):e0228710. doi: 10.1371/journal.pone.0228710. eCollection 2020. PLoS One. 2020. PMID: 32084168 Free PMC article.
References
-
- World Health Organization. Global report on Diabetes. Geneva: 2016 Contract No.: ISBN 978 92 4 156525 7.
Publication types
MeSH terms
Substances
Grants and funding
LinkOut - more resources
Full Text Sources
Medical
