. 2018 Dec 27;13(12):e0209856.
doi: 10.1371/journal.pone.0209856. eCollection 2018.

BioID identifies proteins involved in the cell biology of caveolae

Affiliations

BioID identifies proteins involved in the cell biology of caveolae

C Mendoza-Topaz et al. PLoS One. .

Abstract

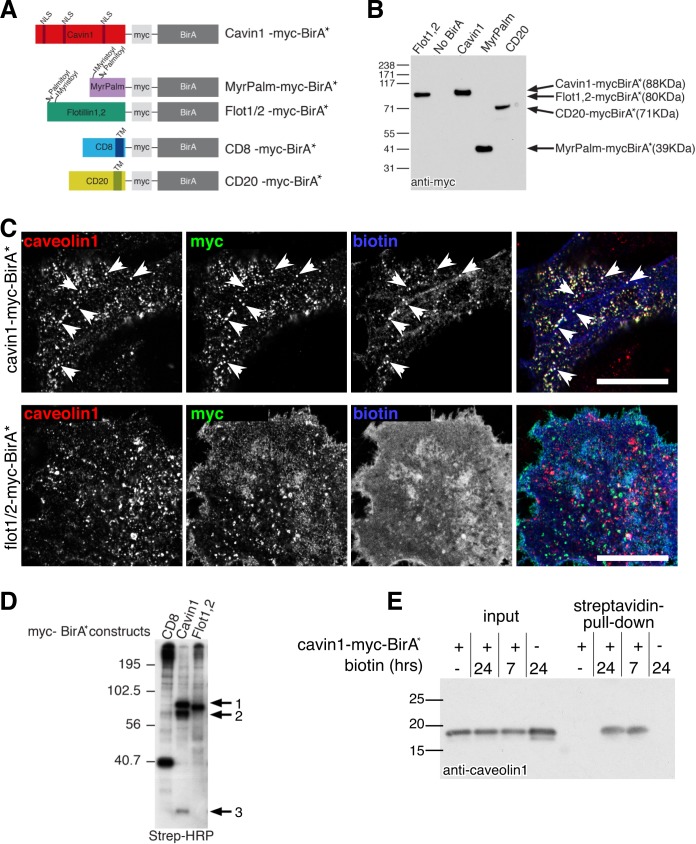
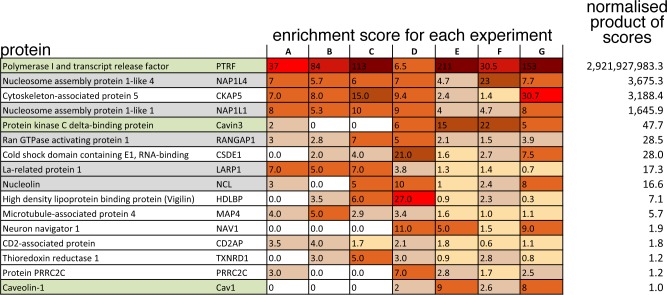
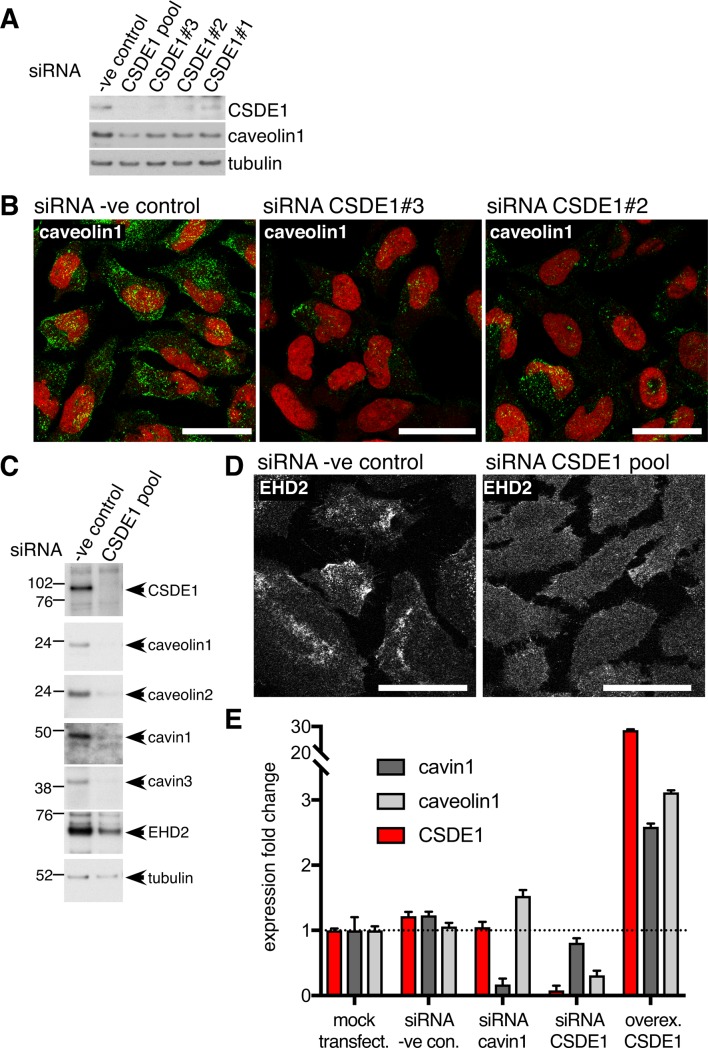
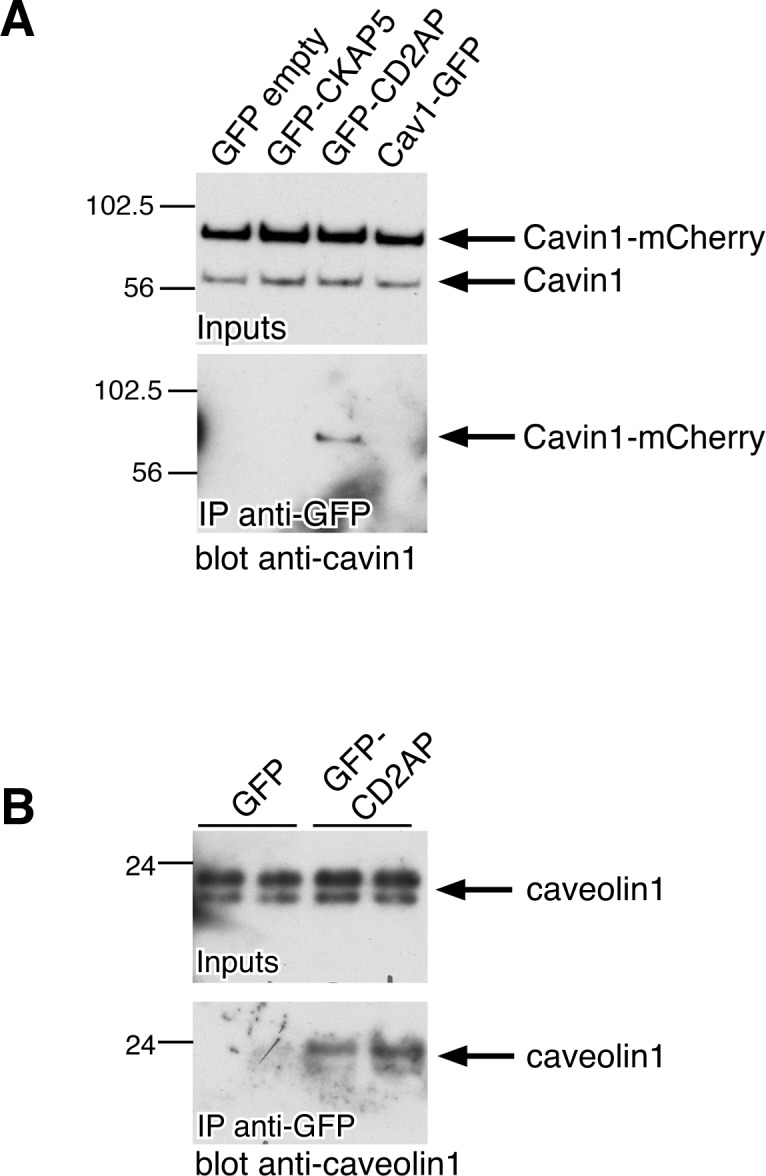
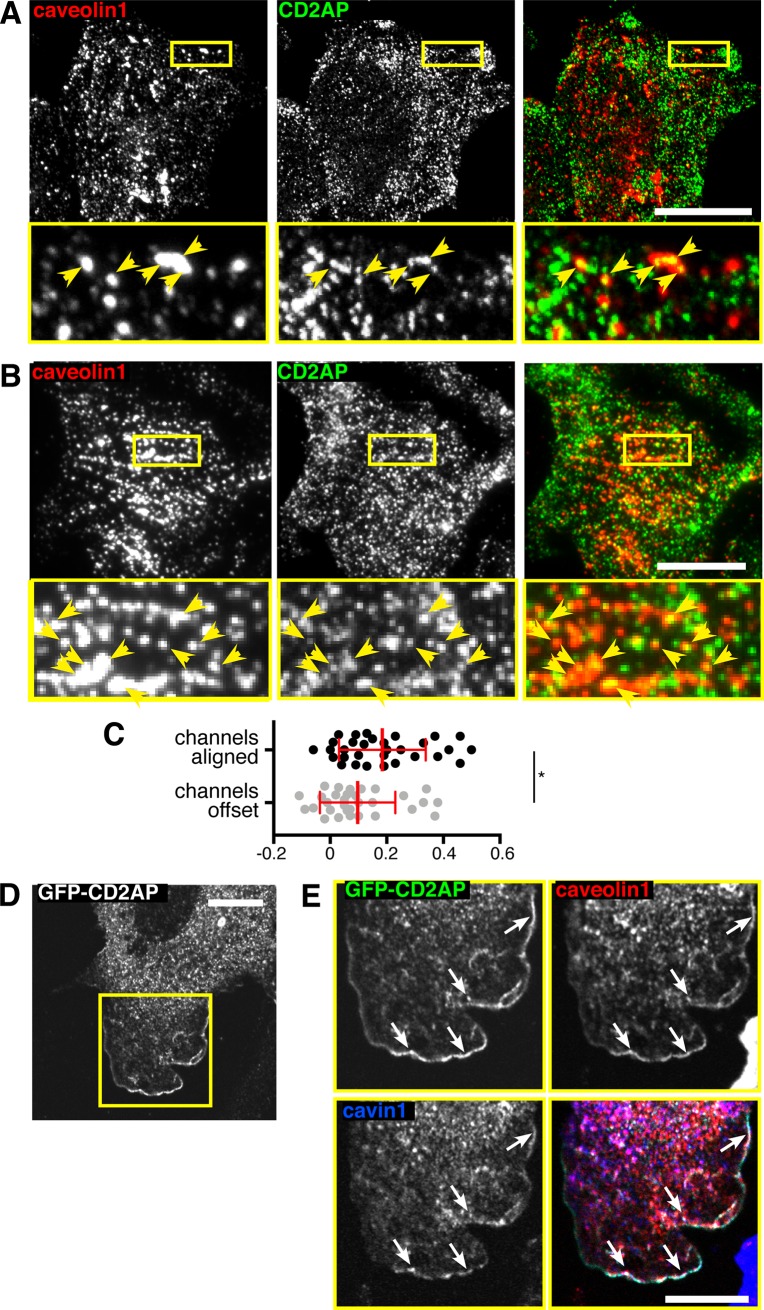
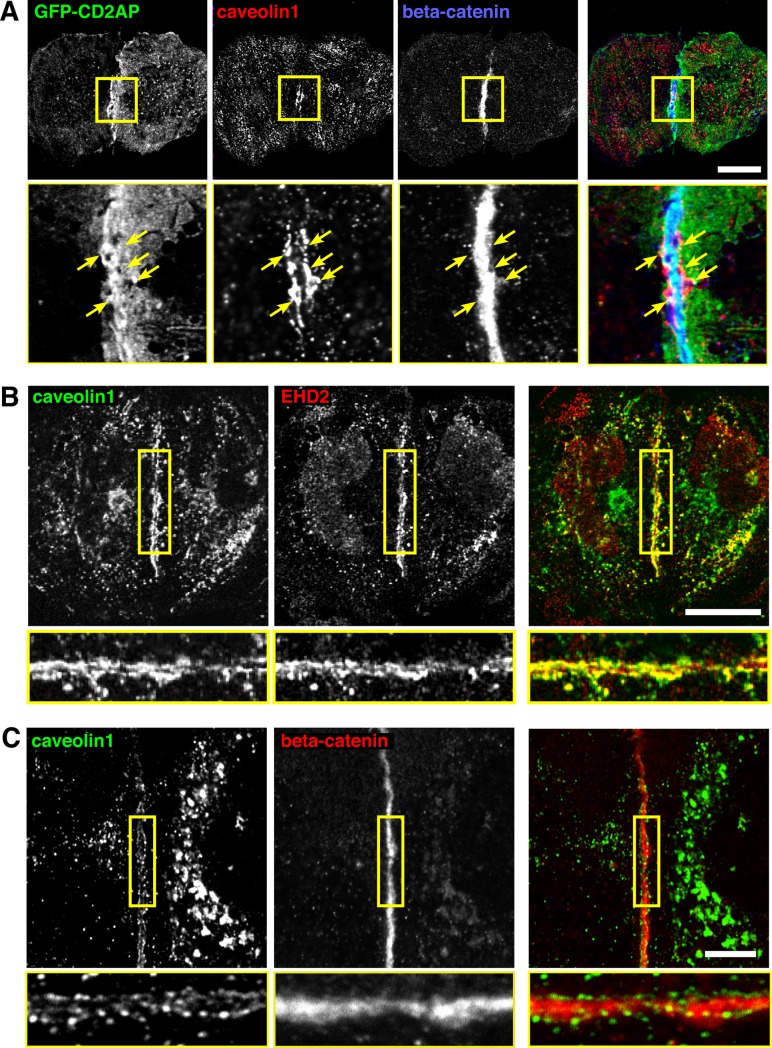
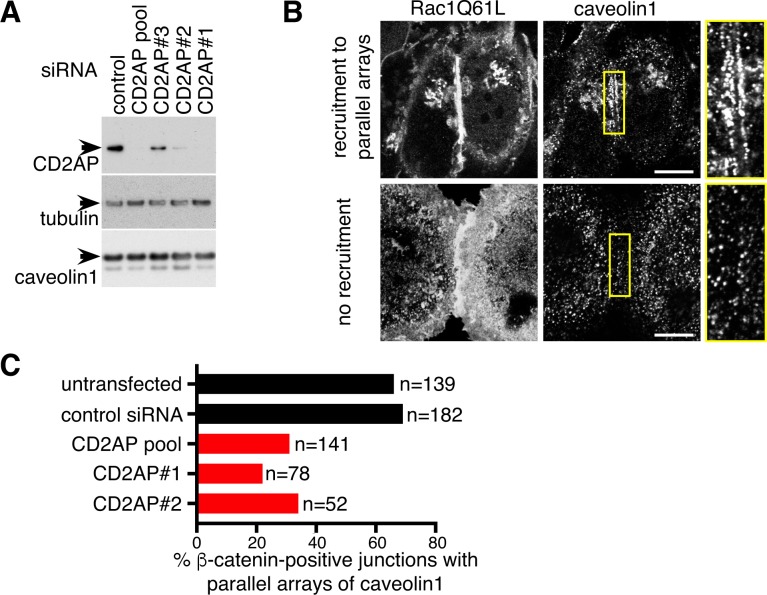
The mechanisms controlling the abundance and sub-cellular distribution of caveolae are not well described. A first step towards determining such mechanisms would be identification of relevant proteins that interact with known components of caveolae. Here, we applied proximity biotinylation (BioID) to identify a list of proteins that may interact with the caveolar protein cavin1. Screening of these candidates using siRNA to reduce their expression revealed that one of them, CSDE1, regulates the levels of mRNAs and protein expression for multiple components of caveolae. A second candidate, CD2AP, co-precipitated with cavin1. Caveolar proteins were observed in characteristic and previously un-described linear arrays adjacent to cell-cell junctions in both MDCK cells, and in HeLa cells overexpressing an active form of the small GTPase Rac1. CD2AP was required for the recruitment of caveolar proteins to these linear arrays. We conclude that BioID will be useful in identification of new proteins involved in the cell biology of caveolae, and that interaction between CD2AP and cavin1 may have an important role in regulating the sub-cellular distribution of caveolae.


Conflict of interest statement

The authors have declared that no competing interests exist.

Figures

Fig 1
Fig 1. Expression of cavin1-myc-BirA* as a tool to label caveolar proteins.
A. Schematic representation of constructs used in this study. B. Expression of constructs used in this study, analysed by Western blotting with anti-myc antibodies. C. Distribution of biotin in transfected cells, compared with caveolae labelled with antibodies against caveolin1. Anti-myc antibodies reveal the location of the indicated BirA* construct. Streptavidin reveals the location of biotinylated proteins. Arrowheads highlight examples of streptavidin-stained caveolae. Bar is 20 microns. Single confocal sections acquired with 63x objective. D. Blot of biotinylated proteins labelled with streptavidin-HRP. Cells were transfected with the myc-BirA* construct indicated at the top of each lane on the blot, and incubated with exogenous biotin before solubilisation. The band labelled 1 in the cavin1-myc-BirA* lane is the correct size to be cavin1-myc-BirA*, 2 is the correct size to be endogenous cavin1, and 3 is the correct size to be caveolin1. E. Western blot labelled with caveolin1 antibody. Cells were transfected with cavin1-myc-BirA* and incubated with exogenous biotin for the times shown, before solubilisation and precipitation of biotinylated proteins with immobilised streptavidin.
Fig 2
Fig 2. Candidate cavin1-interacting proteins identified by BioID.
To show all proteins from 7 pooled BioID experiments with a normalised product of enrichment scores greater than that of caveolin1 –the known caveolar protein to which the scores were normalised. A score of zero means that the specified protein was not detected in that experiment. Protein names are colour coded: green–known caveolar component, grey–nuclear protein. To aid visualisation, enrichment scores are shaded with a higher score having stronger shading.
Fig 3
Fig 3. CSDE1 controls expression of components of caveolae.
A. SiRNAs against CSDE1 reduce caveolin1 levels, as judged by Western blotting with the antibodies shown. Three different single siRNA species were used, as well as a pooled population. B. SiRNAs against CSDE1 reduce caveolin1 levels, as judged by indirect immunofluorescence. Two different single siRNA species were used. Cell nucleii are stained with propidium iodide. Bars 20 microns. Maximum intensity projections of multiple confocal sections acquired at 1 micron intervals, with 63x objective. C. SiRNAs against CSDE1 reduce levels of multiple caveolar components, as judged by Western blotting with the antibodies shown. A pooled population of siRNAs was used. D. SiRNAs against CSDE1 cause delocalisation of EHD2, consistent with loss of recruitment to caveolae. Bars 20 microns. Maximum intensity projections of multiple confocal sections acquired at 1 micron intervals, with 63x objective. E. Quantitative PCR to measure changes in cavin1, caveolin1 and CSDE1 mRNA levels relative to mock-transfected cells. Cells were transfected with the pooled siRNAs shown, or with plasmid for transient over-expression of CSDE1. Bars are SD, N = 3. The experiment was repeated twice with equivalent results.
Fig 4
Fig 4. CD2AP co-precipitates specifically with cavin1 and caveolin1.
A. Western blots labelled with anti-cavin1 antibodies to show input lysates from cells transfected with cavin1-mCherry and constructs shown for each lane, and eluates after immunoprecipitation with anti-GFP antibodies. Cells were solubilised in 0.1% TritonX100 and lysates cleared of insoluble material by centrifugation at 100,000g. Note that even low concentrations of detergent separate complexes of cavin and caveolin proteins. B. Western blots labelled with anti-caveolin1 antibodies to show input lysates from cells transfected with the constructs shown for each lane, and eluates after immunoprecipitation with anti-GFP antibodies. Cells were cross-linked with 0.5mM DSP prior to solubilisation in 1% octylglucoside, 1% TritonX100. Each transfection and precipitation was carried out in duplicate.
Fig 5
Fig 5. CD2AP co-localises with components of caveolae.
A. HeLa cells labelled with anti-caveolin1 and anti-CD2AP antibodies. The region in the yellow box is shown magnified in the lower panels. Bar 20 microns. Maximum intensity projections of multiple confocal sections acquired at 1 micron intervals, with 63x objective. Yellow arrowheads indicate co-localisation. B. HeLa cells labelled with anti-caveolin1 and anti-CD2AP antibodies. The region in the yellow box is shown magnified in the lower panels. Bar 20 microns. Total Internal Reflection imaging, with 63x objective. Yellow arrowheads indicate co-localisation. C. Quantification of Pearson’s correlation coefficient in multiple cell areas from TIR images as shown in B, in either images where the two fluorescence channels are correctly aligned or where they were manually offset by approximately 0.5 microns. Statistical comparison is by t-test (* denote P<0.05). Each dot represents one cell. D. Cell projection induced by overexpression of GFP-CD2AP Bar 5 microns. E. Co-localisation between GFP-CD2AP, caveolin1 antibody labelling, and cavin1-mCherry, in the cell projection shown in D. Single confocal sections acquired with 63x objective, bar is 5 microns. White arrows indicate co-localisation.
Fig 6
Fig 6. Recruitment of caveolin1 adjacent to cell junctions.
A. HeLa cells overexpressing Rac1Q61L-myc and GFP-CD2AP, labelled with anti-caveolin1 and anti-beta-catenin antibodies. The region in the yellow box is shown magnified in the lower panels. Bar 20 microns. Maximum intensity projections of multiple confocal sections acquired at 1 micron intervals, with 63x objective. B. HeLa cells overexpressing Rac1Q61L-myc, labelled with anti-caveolin1 and anti-EHD2 antibodies. The region in the yellow box is shown magnified in the lower panels. Bar 20 microns. Maximum intensity projections of multiple confocal sections acquired at 1 micron intervals, with 63x objective. C. MDCK cells labelled with anti-caveolin1 and anti-beta-catenin antibodies. The region in the yellow box is shown magnified in the lower panels. Bar 10 microns. Single confocal section, with 63x objective.
Fig 7
Fig 7. CD2AP is required for recruitment of caveolin1 to cell junctions.
A. Western blot of cells transfected with the siRNAs shown, using antibodies as indicated. CD2AP siRNAs were either three separate single species or a pooled population containing all three. B. Hela cells overexpressing Rac1Q61L-myc, showing different degrees of recruitment of caveolin1 to cell-cell junctions. These categories were used in the analysis shown in C below. Bars 5 microns, single confocal sections acquired with 63x objective C. Analysis of the recruitment of caveolin1 to cell-cell junctions, as in B, in cells treated with the siRNAs shown stained with anti beta-catenin and anti caveolin 1 antibodies. N = total number of beta-catenin-positive cell-cell junctions analysed.

Similar articles

Cited by

References

    1. Cheng JP, Nichols BJ. Caveolae: One Function or Many? Trends Cell Biol. 2016;26(3):177–89. 10.1016/j.tcb.2015.10.010 Epub Dec 1. - DOI - PubMed
    1. Echarri A, Del Pozo MA. Caveolae—mechanosensitive membrane invaginations linked to actin filaments. J Cell Sci. 2015;128(15):2747–58. 10.1242/jcs.153940 Epub 2015 Jul 9. - DOI - PubMed
    1. Parton RG, del Pozo MA. Caveolae as plasma membrane sensors, protectors and organizers. Nat Rev Mol Cell Biol. 2013;14(2):98–112. Epub 2013/01/24. nrm3512 [pii] 10.1038/nrm3512 . - DOI - PubMed
    1. Shvets E, Ludwig A, Nichols BJ. News from the caves: update on the structure and function of caveolae. Curr Opin Cell Biol. 2014;29:99–106. 10.1016/j.ceb.2014.04.011 Epub Jun 5. - DOI - PubMed
    1. Andrews NW, Almeida PE, Corrotte M. Damage control: cellular mechanisms of plasma membrane repair. Trends Cell Biol. 2014;20(14):00122–6. - PMC - PubMed

Publication types