. 2018 Dec 27;13(12):e0209861.
doi: 10.1371/journal.pone.0209861. eCollection 2018.

Conformational fingerprint of blood and tissue ACEs: Personalized approach

Affiliations

Conformational fingerprint of blood and tissue ACEs: Personalized approach

Sergei M Danilov et al. PLoS One. .

Abstract

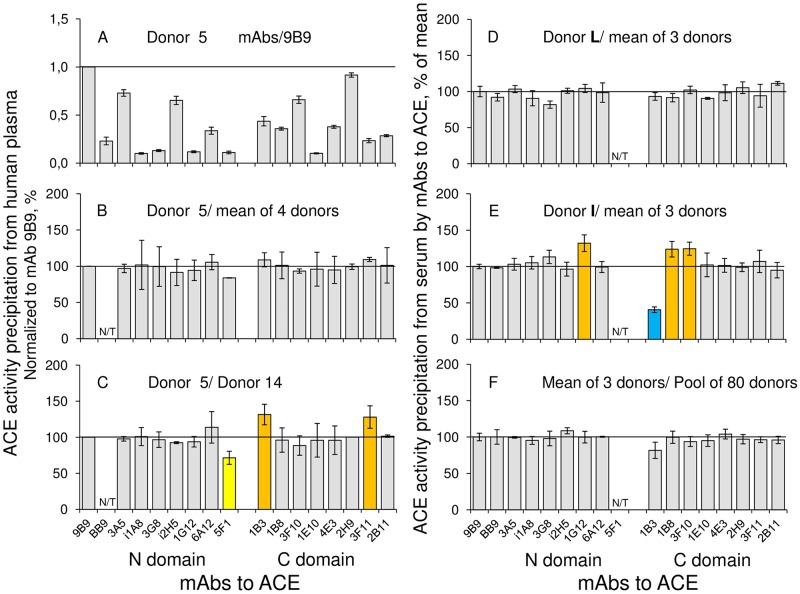
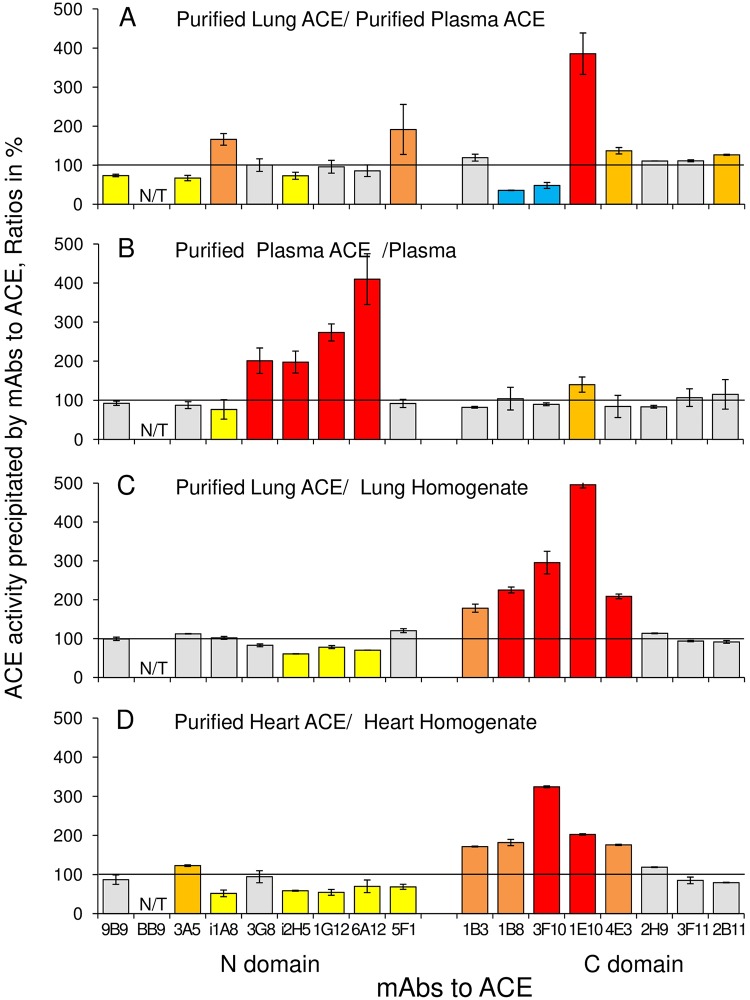
Background: The pattern of binding of monoclonal antibodies (mAbs) to 18 epitopes on human angiotensin I-converting enzyme (ACE)-"conformational fingerprint of ACE"-is a sensitive marker of subtle conformational changes of ACE due to mutations, different glycosylation in various cells, the presence of ACE inhibitors and specific effectors, etc.

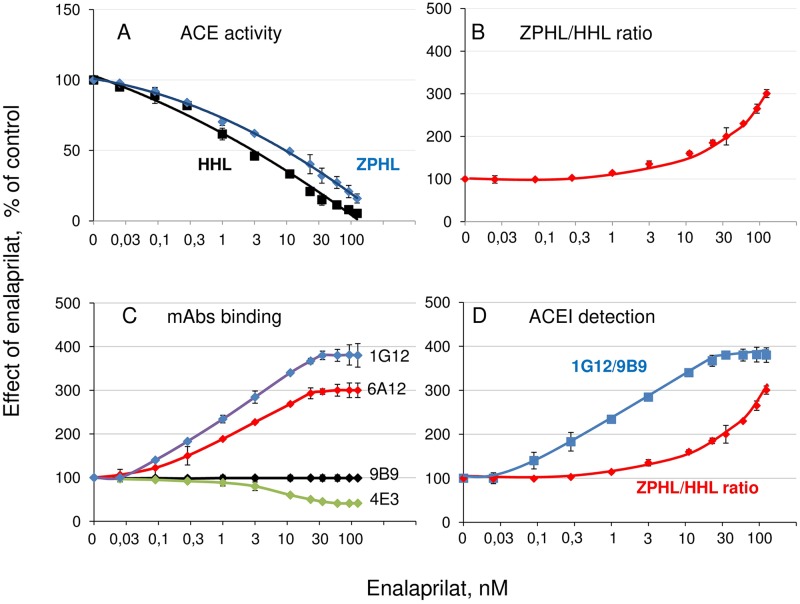
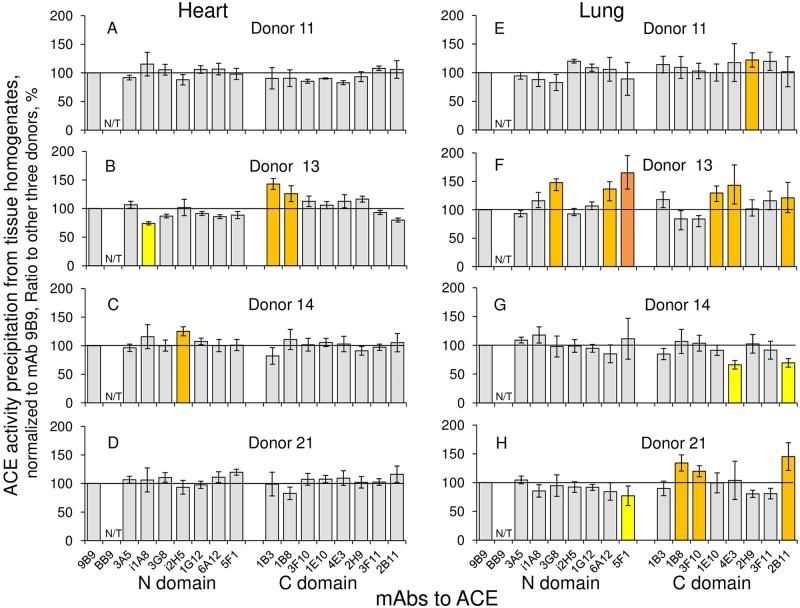
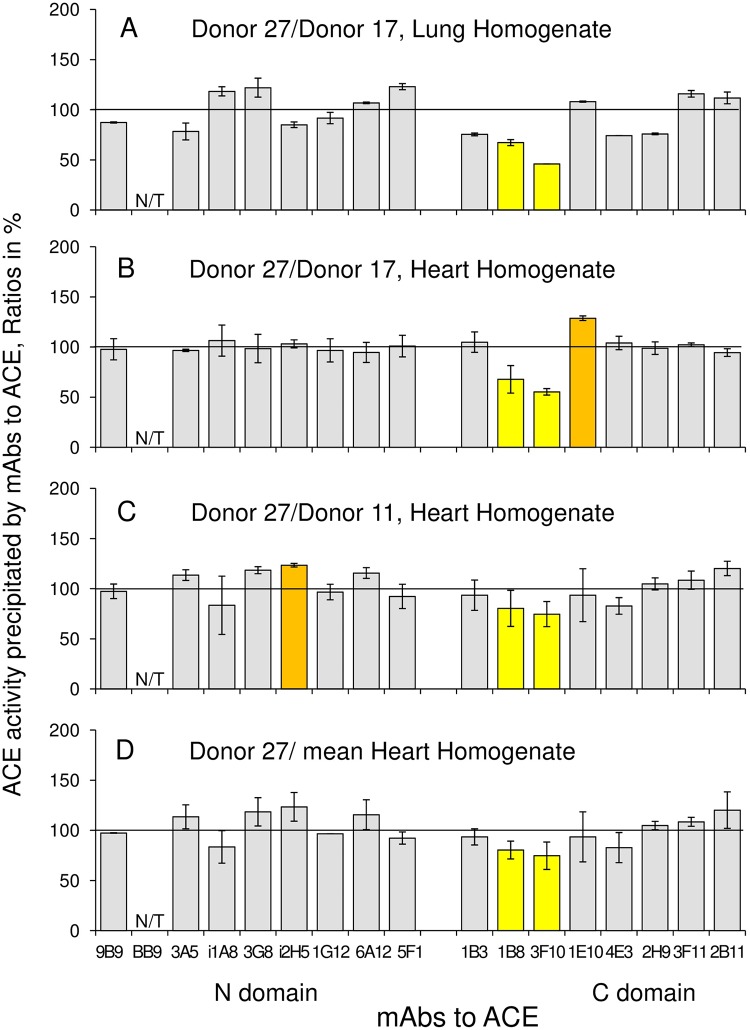
Methodology/principal findings: We described in detail the methodology of the conformational fingerprinting of human blood and tissue ACEs that allows detecting differences in surface topography of ACE from different tissues, as well detecting inter-individual differences. Besides, we compared the sensitivity of the detection of ACE inhibitors in the patient's plasma using conformational fingerprinting of ACE (with only 2 mAbs to ACE, 1G12 and 9B9) and already accepted kinetic assay and demonstrated that the mAbs-based assay is an order of magnitude more sensitive. This approach is also very effective in detection of known (like bilirubin and lysozyme) and still unknown ACE effectors/inhibitors which nature and set could vary in different tissues or different patients.

Conclusions/significance: Phenotyping of ACE (and conformational fingerprinting of ACE as a part of this novel approach for characterization of ACE) in individuals really became informative and clinically relevant. Appreciation (and counting on) of inter-individual differences in ACE conformation and accompanying effectors make the application of this approach for future personalized medicine with ACE inhibitors more accurate. This (or similar) methodology can be applied to any enzyme/protein for which there is a number of mAbs to its different epitopes.


Conflict of interest statement

The authors have declared that no competing interests exist.

Figures

Fig 1
Fig 1. Enzyme (ACE) immune-capture assay.
A. Scheme of the method. Goat anti-mouse IgG are loaded on the 96-wells plate to minimize non-specific adsorption of both mAbs and ACE, as well as prevent putative denaturation of some mAbs as a result of a contact with plastic. After washing of unbound anti-mouse IgG, mAbs to ACE are applied to the plate and, after another washing, analyzed ACE source is added. The amount of ACE in complex with any mAb is estimated by measuring precipitated ACE activity towards specific substrate, usually ZPHL, added directly into the wells. B. The dependence of the fluorescence (reflecting relative ACE activity in wells) on the loaded ACE activity on wells covered by strong mAb 9B9 (10 μg/ml) and weak mAb 1E10 (10 μg/ml). C. The dependence of the fluorescence signal on the loaded ACE activity at different concentrations of the loaded strong mAb 9B9. D. The dependence of the fluorescence signal on the loaded ACE activity at different concentrations of the loaded weak mAb 1E10.
Fig 2
Fig 2. Effect of plate washing on the dissociation of ACE inhibitor from ACE.
The residual ACE activity towards substrates, HHL and ZPHL, as well the ratio of the rates of the hydrolysis of these substrates, ZPHL/HHL ratio, were determined in the wells coated by goat anti-mouse IgG, four mAbs to ACE (strong and weak) and, then, the mixture of purified seminal fluid ACE with inhibitor enalaprilat (100 nM) after different number of washings with water with 0.05% (v/v) Tween 20. The ZPHL/HHL ratio for ACE in solution in the presence of the inhibitor (red bar in the right column) is shown for comparison. Data are expressed as a % of control (i.e. ACE without inhibitor) and presented as a mean of at least 3 independent experiments. The coloring here and in other figures is as follows: Values increased more than by 20% are highlighted in orange, more than 50% are highlighted in dark orange, more than by 100% are highlighted in red. Values decreased more than by 20% are highlighted in yellow.
Fig 3
Fig 3. Effect of TritonX-100 on the mAbs binding to purified lung ACE. A-C.
The effect of different concentrations of detergent Triton X-100 on the precipitation of ACE activity from ACE purified from human lung homogenate. Data are expressed as a % of control (i.e. without Triton X-100) and presented as a mean of at least 3 independent experiments. N/T–not tested mAbs. The coloring is as in the legend to Fig 2, and, in addition, values decreased more than by 50% are highlighted in deep blue.
Fig 4
Fig 4. Effect of 0.25% Triton X-100 on mAbs binding to different ACEs.
Data are expressed as a % of control (i.e., the source of ACE without Triton X-100) and presented as a mean of at least 3 independent experiments. N/T–not tested mAbs. The coloring is as in the legend to Fig 3.
Fig 5
Fig 5. Effect of storage of lung homogenate on the recognition of ACE by mAbs.
Freshly prepared human lung homogenate was prepared and then aliquoted into individual volumes for storage. Precipitation of ACE activity was compared for freshly prepared homogenate and the same homogenate but stored for different time and at different temperatures. A-C. Storage of homogenate at 4°C for different periods of time. D. Short freezing at -20°C. Data are expressed as a % of control (i.e., initial precipitation of ACE from freshly prepared lung homogenate) and presented as a mean of at least 3 independent experiments. N/T–not tested mAbs. The coloring is as in the legend to Fig 3.
Fig 6
Fig 6. The detection of ACE inhibitors in the plasma of patients.
Two different approaches for the detection of ACE inhibitors in the plasma of patients were compared using pooled citrated plasma from 80 patients not taking ACE inhibitors. The samples of plasma were spiked with different concentrations of enalaprilat. A-B. Enzymatic approach. A. ACE activity was determined by the rates of hydrolysis of two substrates, HHL and ZPHL, at different concentrations of ACE inhibitor enalaprilat, % from initial ACE activity. B. The ratio of the rates of the hydrolysis of substrates HHL and ZPHL, ZPHL/HHL ratio, determined in the presence of different enalaprilat concentrations, % from the value of the ratio in the absence of the inhibitor. C. Antibody-based assay: the efficacy of mAbs binding to ACE at different enalaprilat concentrations, % from the binding in the absence of the inhibitor. D. The comparison of enzymatic and mAbs-based methods. The effects of different concentrations of enalaprilat on two parameters, the ratio of the binding of mAbs 1G12 and 9B9 to ACE, 1G12/9B9, and ZPHL/HHL ratio. Data are expressed as a % of control (i.e., without ACE inhibitor enalaprilat) and presented as a mean of at least 3 independent experiments ± SD.
Fig 7
Fig 7. Comparative binding of mAbs to ACE from different donors.
Conformational fingerprinting of ACE in plasma from donors with a set of mAbs to ACE. A. mAb/9B9 ratio for one of the donors, 5th donor. B. The ratio of mAbs binding to ACE in plasma of 5th donor to that for the mean for four donors. C. The ratio of precipitated activity of ACE in plasma of 5th donor to that of 14th donor is presented in order to highlight differences in immunoprecipitation pattern (“conformational fingerprint”) among ACE from blood of different donors. D,E. The ratio of mAbs binding to ACE in serum samples from two different donors to that for the mean for three donors. F. The ratio of mAbs binding to ACE in pooled serum samples from three donors to that for ACE pooled from 80 samples of normal plasma. Data for mAbs binding to ACE from all donors were preliminary normalized to the binding of the most strong mAb 9B9 to ACE from the same donor (as in A). The values obtained were used for the calculation of the ratios between different donors, expressed in % (B-F) and presented as a mean of at least 3 independent experiments. N/T–not tested mAbs. The coloring is as in the legend to Fig 3.
Fig 8
Fig 8. Comparative binding of mAbs to ACE from different tissues.
Conformational fingerprinting of ACE in homogenates of heart and lung tissues from different donors with a set of mAbs to ACE. A-D. The ratio of immunoprecipitated ACE activity from heart homogenate of 11th, 13th, 14th, and 21st donor to that for other three donors. E-H. The ratio of immunoprecipitated ACE activity from lung homogenate of 11th, 13th, 14th, and 21st donor to that for other three donors. Data are normalized as in the legend to Fig 7 (to 9B9 precipitation), the ratios are expressed in % and presented as a mean of at least 3 independent experiments. N/T–not tested mAbs. The coloring is as in the legend to Fig 3.
Fig 9
Fig 9. Inter-individual differences of the conformation of ACE from heart and lung.
The ratios of precipitated ACE activity from any tissue homogenate to precipitated ACE activity from another homogenate is shown for clarity. A. The ratio of precipitated ACE activity from lung homogenate of 27th donor to that of 17th donor. B. The ratio of precipitated ACE activity from heart homogenate of 27th donor to that of 17th donor. C. The ratio of precipitated ACE activity from heart homogenate of 27th donor to that of 11th donor. D. The ratio of precipitated ACE activity from heart homogenate of 27th donor to that for mean from 17th and 11th donor. Data are expressed in % and presented as a mean of at least 3 independent experiments. N/T–not tested mAbs. The coloring is as in the legend to Fig 3.
Fig 10
Fig 10. Effect of purification on the binding of mAbs to different ACEs.
ACE activity in any pair of tested sources of ACEs was equilibrated with ZPHL as a substrate and precipitation of ACE activity was performed as in Fig 3. A. The ratio of precipitated activity of pure lung ACE to that of pure plasma ACE. B. Effect of ACE purification from human plasma on mAbs binding. C Effect of ACE purification from human heart homogenate (1:9, tissue:buffer) on mAbs binding. D. Effect of ACE purification o from human lung homogenate (1:9, tissue:buffer) on mAbs binding. Ratios are expressed in % and presented as a mean of at least 3 independent experiments. N/T–not tested mAbs. The coloring is as in the legend to Fig 3.

Similar articles

Cited by

References

    1. Sturrock ED, Anthony CS, Danilov SM (2012) Peptidyl-dipeptidase A/Angiotensin I-converting enzyme In: Rawlings ND; Salvesen G, ed. Handbook of Proteolytic Enzymes, 3rd edn Oxford, Academic Press: 480–494.
    1. Bernstein KE, Ong FS, Blackwell WL, Shah KH, Giani JF, Gonzalez-Villalobos RA, et al. (2013) A modern understanding of the traditional and nontraditional biological functions of Angiotensin-converting enzyme. Pharmacol Rev 65: 1–46. 10.1124/pr.112.006809 - DOI - PMC - PubMed
    1. Soubrier F, Alhenc-Gelas F, Hubert C, Allegrini J, John M, Tregear G, et al. (1988) Two putative active centers in human angiotensin I-converting enzyme revealed by molecular cloning. Proc Natl Acad Sci USA 85: 9386–9390. - PMC - PubMed
    1. Danilov SM, Gordon K, Nesterovitch AB, Chen Z, Castellon M, Popova IA, et al. (2011) An angiotensin I-converting enzyme mutation (Y465D) causes a dramatic increase in blood ACE via accelerated ACE shedding. PLoS One 6: e25952 10.1371/journal.pone.0025952 - DOI - PMC - PubMed
    1. Danilov SM, Balyasnikova IB, Danilova AS, Naperova IA, Arablinskaya E, Borisov SE, et al. (2010) Conformational fingerprinting of the angiotensin-converting enzyme (ACE): Application in sarcoidosis. J Proteome Res 9: 5782–5793. 10.1021/pr100564r - DOI - PubMed

Publication types