Proportion of Cancer Cases Attributable to Excess Body Weight by US State, 2011-2015
- PMID: 30589925
- PMCID: PMC6521676
- DOI: 10.1001/jamaoncol.2018.5639
Proportion of Cancer Cases Attributable to Excess Body Weight by US State, 2011-2015
Abstract
Importance: Excess body weight (EBW) is an established cause of cancer. Despite variations in the prevalence of EBW among US states, there is little information on the EBW-related cancer burden by state; this information would be useful for setting priorities for cancer-control initiatives.
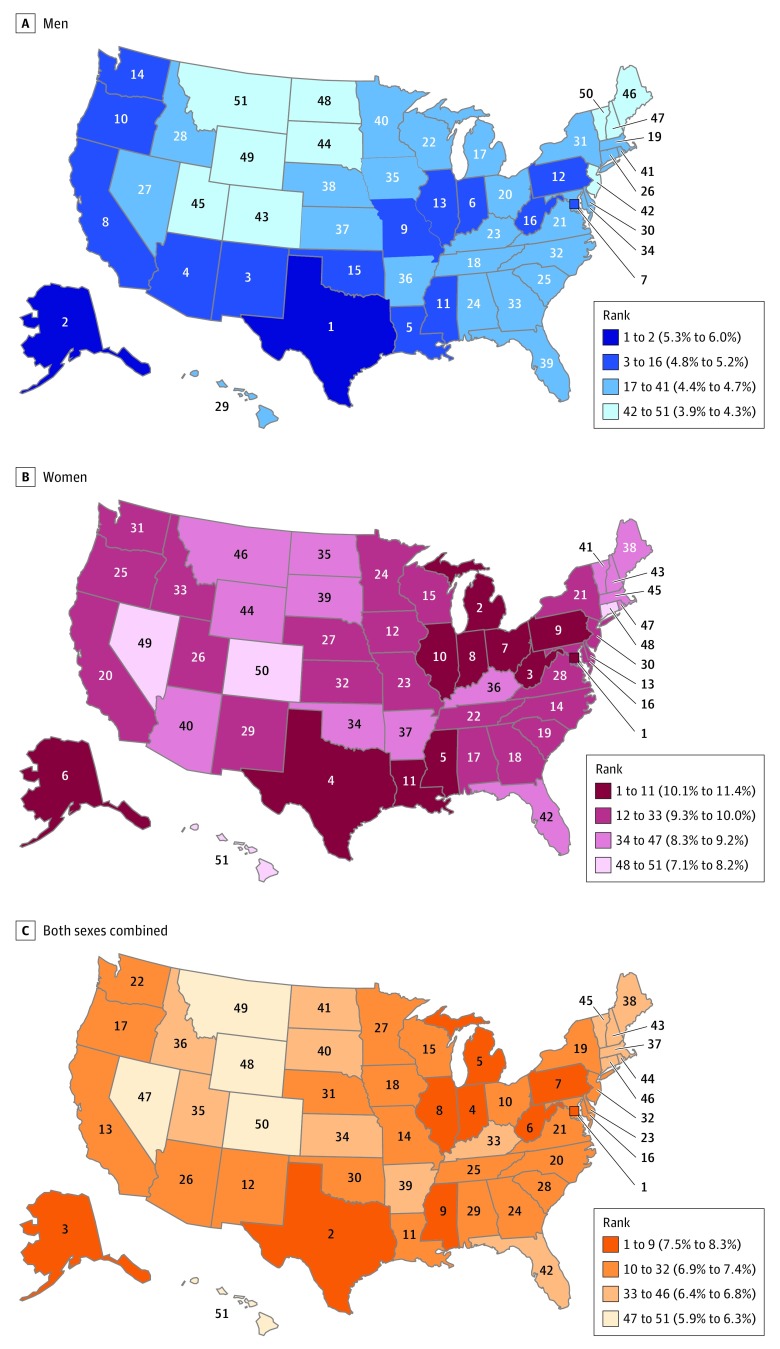
Objective: To calculate the population attributable fraction (PAF) of incident cancer cases attributable to EBW among adults 30 years or older in 2011 to 2015 in all 50 states and the District of Columbia.
Design, setting, and participants: State-level, self-reported body mass index (BMI [calculated as weight in kilograms divided by height in meters squared]) data from the Behavioral Risk Factor Surveillance System were adjusted by sex, age, race/ethnicity, and education using objectively measured BMI values from the National Health and Nutrition Examination Survey. Age- and sex-specific cancer incidence data by state were obtained from the US Cancer Statistics database. All analyses were performed between February 15, 2018, and July 17, 2018.
Main outcomes and measures: Sex-, age-, and state-specific adjusted prevalence estimates for 4 high BMI categories and corresponding relative risks from large-scale pooled analyses or meta-analyses were used to compute the PAFs for each US state for esophageal adenocarcinoma, multiple myeloma, and cancers of the gastric cardia, colorectum, liver, gallbladder, pancreas, female breast, corpus uteri, ovary, kidney and renal pelvis, and thyroid.
Results: Each year, an estimated 37 670 cancer cases in men (4.7% of all cancer cases excluding nonmelanoma skin cancers) and 74 690 cancer cases in women (9.6%) 30 years or older in the United States were attributable to EBW from 2011 to 2015. In both men and women, there was at least a 1.5-fold difference in the proportions of cancers attributable to EBW between states with the highest and lowest PAFs. Among men, the PAF ranged from 3.9% (95% CI, 3.6%-4.3%) in Montana to 6.0% (95% CI, 5.6%-6.4%) in Texas. The PAF for women was approximately twice as high as for men, ranging from 7.1% (95% CI, 6.7%-7.6%) in Hawaii to 11.4% (95% CI, 10.7%-12.2%) in the District of Columbia. The largest PAFs were found mostly in southern and midwestern states, as well as Alaska and the District of Columbia.
Conclusions and relevance: The proportion of cancers attributable to EBW varies among states, but EBW accounts for at least 1 in 17 of all incident cancers in each state. Broad implementation of known community- and individual-level interventions is needed to reduce access to and marketing of unhealthy foods (eg, through a tax on sugary drinks) and to promote and increase access to healthy foods and physical activity, as well as preventive care.
Conflict of interest statement
Figures
References
-
- Fryar CD, Carroll MD, Ogden CL Prevalence of overweight, obesity, and extreme obesity among adults aged 20 and over: United States, 1960–1962 through 2011–2014. National Center for Health Statistics Data, Health E-Stats. July 2016. https://www.cdc.gov/nchs/data/hestat/obesity_adult_13_14/obesity_adult_1.... Accessed November 19, 2018.
Publication types
MeSH terms
LinkOut - more resources
Full Text Sources
Medical