. 2019 Apr;28(7):1624-1636.
doi: 10.1111/mec.15000.

GST' , Jost's D, and FST are similarly constrained by allele frequencies: A mathematical, simulation, and empirical study

Affiliations

GST' , Jost's D, and FST are similarly constrained by allele frequencies: A mathematical, simulation, and empirical study

Nicolas Alcala et al. Mol Ecol. 2019 Apr.

Abstract

Statistics GST' and Jost's D have been proposed for replacing FST as measures of genetic differentiation. A principal argument in favour of these statistics is the independence of their maximal values with respect to the subpopulation heterozygosity HS , a property not shared by FST . Nevertheless, it has been unclear if these alternative differentiation measures are constrained by other aspects of the allele frequencies. Here, for biallelic markers, we study the mathematical properties of the maximal values of GST' and D, comparing them to those of FST . We show that GST' and D exhibit the same peculiar frequency-dependence phenomena as FST , including a maximal value as a function of the frequency of the most frequent allele that lies well below one. Although the functions describing GST' , D, and FST in terms of the frequency of the most frequent allele are different, the allele frequencies that maximize them are identical. Moreover, we show using coalescent simulations that when taking into account the specific maximal values of the three statistics, their behaviours become similar across a large range of migration rates. We use our results to explain two empirical patterns: the similar values of the three statistics among North American wolves, and the low D values compared to GST' and FST in Atlantic salmon. The results suggest that the three statistics are often predictably similar, so that they can make quite similar contributions to data analysis. When they are not similar, the difference can be understood in relation to features of genetic diversity.

Keywords: allele frequency; gene flow; genetic differentiation; migration; population structure.


Figures

FIGURE 1
FIGURE 1
Range of possible values of FST, GST, and D as functions of the frequency M of the most frequent allele, for different numbers of subpopulations K. The shaded region represents the space between the minimal and maximal values. The maximal FST, GST, and D are computed from Equations 9–11, respectively. The dashed line represents 1 for FST and GST, and 2KM(1 − M)/(K − 1) for D (Equation S1.4 in Supporting Information File S1); the maximum value touches the dashed line when M = i/K for integers i in [K2,K1]. For FST, GST, and D, for each K, the minimum value is 0 for all values of M
FIGURE 2
FIGURE 2
The means AF, AG, and AD of the maximal values of FST, GST, and D, respectively, over the interval M ∈ [1/2, 1), as functions of the number of subpopulations K. AF(K) is computed from Equation 12, AG(K) from Equation 13, and AD(K) from Equation 14. The x-axis is plotted on a logarithmic scale
FIGURE 3
FIGURE 3
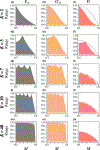
Joint density of the frequency M of the most frequent allele and statistics FST, GST, and D, for different scaled migration rates 4Nm, considering K = 2 subpopulations. The black solid line represents the maximum value of FST, GST, or D in terms of M (Equations 9–11); the red dashed line represents the mean FST, GST, and D in sliding windows of M of size 0.02 (plotted from 0.51 to 0.99). Colours represent the density of loci, estimated using a Gaussian kernel density estimate with a bandwidth of 0.007, with density set to 0 outside the minimum and maximum values. Loci are simulated using coalescent software MS, assuming an island model of migration and conditioning on one segregating site. Each panel considers 100,000 replicate simulations, with 100 lineages sampled per subpopulation
FIGURE 4
FIGURE 4
Joint density of the frequency M of the most frequent allele and statistics FST, GST, and D, for different scaled migration rates 4Nm, considering K = 7 subpopulations. The simulation procedure and figure design follow Figure 3
FIGURE 5
FIGURE 5
Mean F¯ST,G¯ST, and D across biallelic loci. (a) Unnormalized means F¯ST,G¯ST, and D. (b) Normalized means F¯ST/F¯max,G¯ST/G¯max and D¯/D¯max, the ratio of the mean value to the mean maximal value given the observed frequency M of the most frequent allele. Both plots show quantities as functions of the number of subpopulations K and the scaled migration rate 4Nm. Colours represent the different statistics. Line types represent values of K: 2 (solid), 7 (dashed), and 40 (dotted). Values are computed from coalescent simulations using software ms as in Figure 3, with 1,000 replicate biallelic loci and 100 lineages per subpopulation. F¯max,G¯max and < D¯max are respectively computed from equation 11 of Alcala and Rosenberg (2017) and Equations D3 and D4 in Appendix D
FIGURE 6
FIGURE 6
Joint density of the frequency M of the most frequent allele and three differentiation measures (FST, GST, and D), and unnormalized and normalized mean values of the differentiation measures across loci, for 305 wolves and 91 dogs from North America, using 123,801 SNPs. (a) M and FST. (b) M and GST. (c) M and D. (d) Unnormalized mean values of FST, GST, and D across SNPs, and the mean values of FST, GST, and D across SNPs normalized by the mean of their maximal values. In (a-c), the figure design follows Figure 3. In (d), F¯max,G¯max, and D¯max are respectively computed from equation 11 of Alcala and Rosenberg (2017) and Equations D3 and D4 in Appendix D
FIGURE 7
FIGURE 7
Joint density of the frequency M of the most frequent allele and three differentiation measures (FST, GST, and D), and unnormalized and normalized mean values of the differentiation measures across loci, for 900 Atlantic salmon from 26 populations, using 1,335 SNPs. Sample sizes range from 25 to 40 per population. (a) M and FST. (b) M and GST. (c) M and D. (d) Mean values of FST, GST, and D across SNPs, for sets of geographic regions as a function of K, the number of regions considered. (e) Ratio of mean values of FST, GST, and D across SNPs to their maximal mean values as functions of K. In (a-c), the figure design follows Figure 3. Coloured bars in (d) and (e) represent 2.5 and 97.5 quantiles of distributions of values across sets of size K. In (e), F¯max,G¯max,andD¯max are respectively computed from equation 11 of Alcala and Rosenberg (2017) and Equations D3 and D4 in Appendix D

References

    1. Alcala N, Goudet J, & Vuilleumier S. (2014). On the transition of genetic differentiation from isolation to panmixia: What we can learn from GST and D. Theoretical Population Biology, 93, 75–84. 10.1016/j.tpb.2014.02.003 - DOI - PubMed
    1. Alcala N, & Rosenberg NA (2017). Mathematical constraints on FST: Biallelic markers in arbitrarily many populations. Genetics, 206, 1581–1600. 10.1534/genetics.116.199141 - DOI - PMC - PubMed
    1. Balloux F, Brünner H, Lugon-Moulin N, Hausser J, & Goudet J. (2000). Microsatellites can be misleading: An empirical and simulation study. Evolution, 54, 1414–1422. 10.1111/j.0014-3820.2000.tb00573.x - DOI - PubMed
    1. Beaumont MA, & Nichols RA (1996). Evaluating loci for use in the genetic analysis of population structure. Proceedings of the Royal Society of London. Series B: Biological Sciences, 263, 1619–1626.
    1. Bourret V, Kent MP, Primmer CR, Väsemagi A, Karlsson S, Hindar K, … Lien S. (2013). SNP-array reveals genome-wide patterns of geographical and potential adaptive divergence across the natural range of Atlantic salmon (Salmo salar). Molecular Ecology, 22, 532–551. 10.1111/mec.12003 - DOI - PubMed

Publication types