. 2018 Dec 26;25(13):3545-3553.e2.
doi: 10.1016/j.celrep.2018.12.003.

Disruption of the Interaction of RAS with PI 3-Kinase Induces Regression of EGFR-Mutant-Driven Lung Cancer

Affiliations

Disruption of the Interaction of RAS with PI 3-Kinase Induces Regression of EGFR-Mutant-Driven Lung Cancer

Miguel M Murillo et al. Cell Rep. .

Abstract

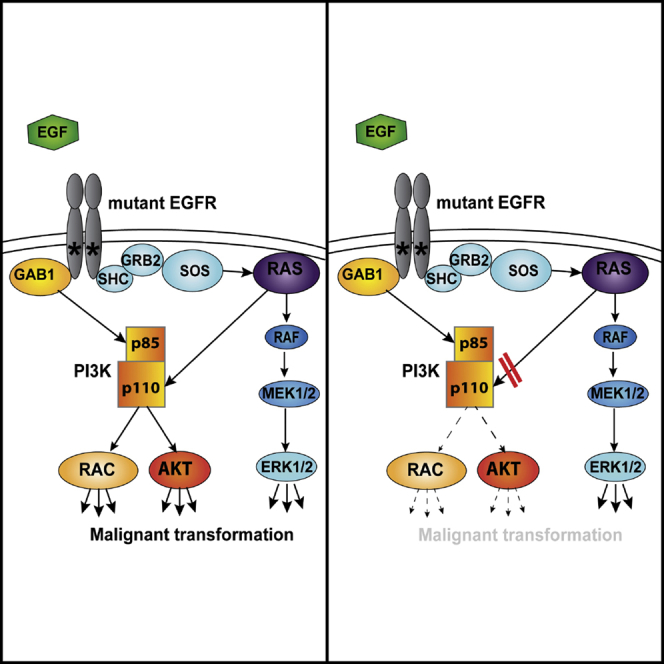
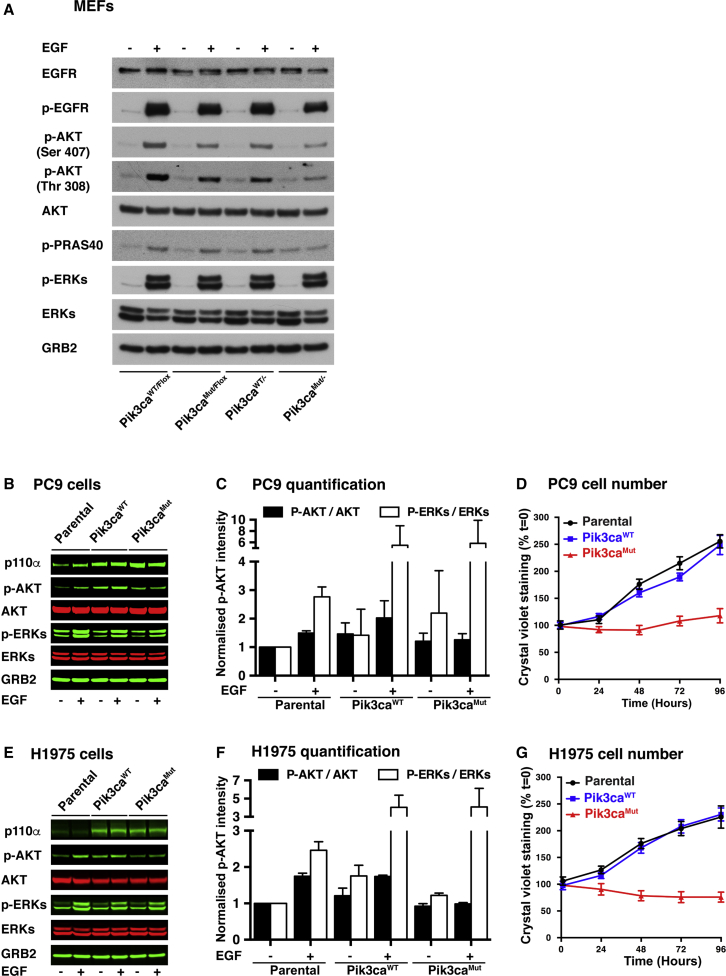
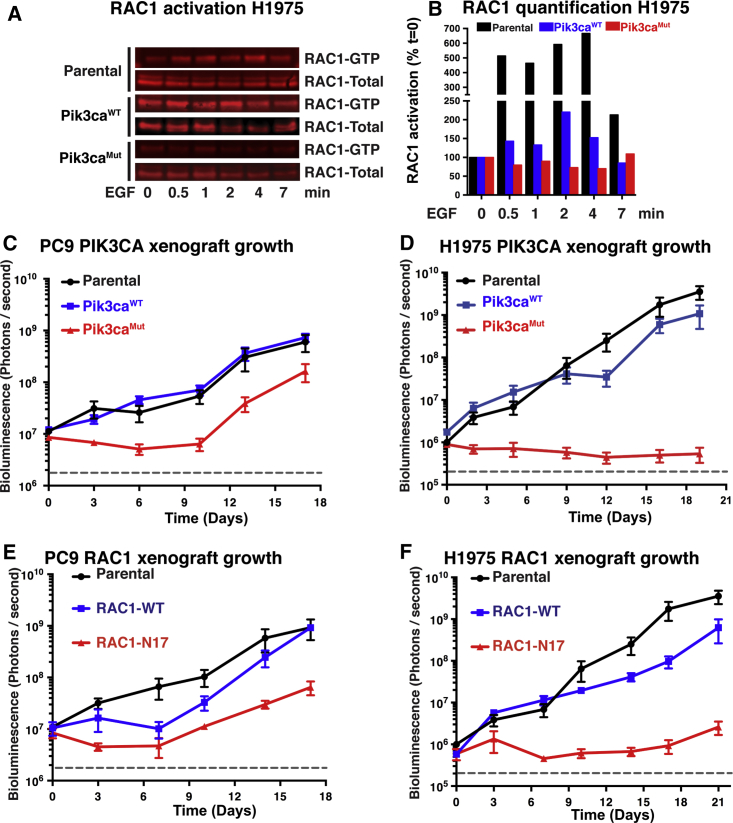
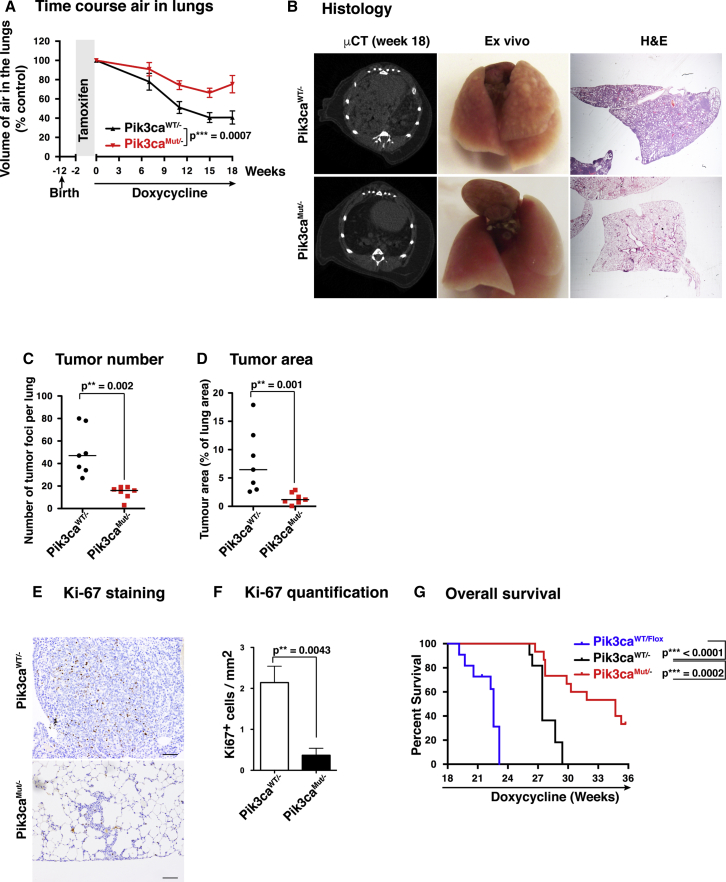
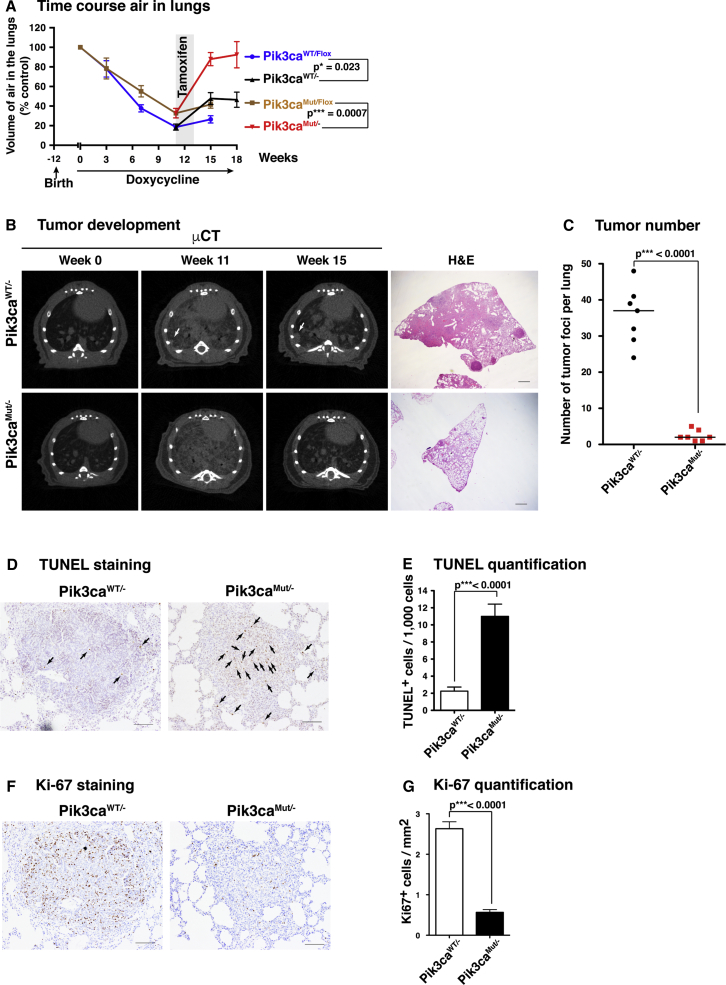
RAS family GTPases contribute directly to the regulation of type I phosphoinositide 3-kinases (PI3Ks) via RAS-binding domains in the PI3K catalytic p110 subunits. Disruption of this domain of p110α impairs RAS-mutant-oncogene-driven tumor formation and maintenance. Here, we test the effect of blocking the interaction of RAS with p110α on epidermal growth factor receptor (EGFR)-mutant-driven lung tumorigenesis. Disrupting the RAS-PI3K interaction inhibits activation of both AKT and RAC1 in EGFR-mutant lung cancer cells, leading to reduced growth and survival, and inhibits EGFR-mutant-induced tumor onset and promotes major regression of established tumors in an autochthonous mouse model of EGFR-mutant-induced lung adenocarcinoma. The RAS-PI3K interaction is thus an important signaling node and potential therapeutic target in EGFR-mutant lung cancer, even though RAS oncogenes are not themselves mutated in this setting, suggesting different strategies for tackling tyrosine kinase inhibitor resistance in lung cancer.

Keywords: EGFR; KRAS; PI3K; PIK3CA; RAC1; RAS; lung cancer.


Figures

None
Graphical abstract
Figure 1
Figure 1
Expression of RAS-Binding Domain-Mutant p110α in EGFR-Mutant Lung Cancer Cells Impairs Growth and Inhibits the Activation of AKT (A) Pik3caWT/Flox and Pik3caMUT/Flox MEFs (expressing ROSA26 Cre-ER) were treated overnight with 1 μM tamoxifen or vehicle to generate Pik3caWT/− and Pik3caMUT/− MEFs. Cells were starved overnight and stimulated for 10 min with epidermal growth factor (EGF) (10 ng/mL) or vehicle. Proteins were collected and subjected to western blot analysis as indicated. One representative experiment from three is shown. (B and E) PC9 (B) and H1975 (E) EGFR-mutant lung cancer cells were infected with retroviruses encoding Pik3caWT or Pik3caMUT or not infected (parental). Cells were then starved and stimulated with EGF (10 ng/mL) or vehicle for 10 min. Proteins were collected and subjected to western blot analysis as indicated. One representative experiment from three is shown. (C) Quantification of the western blots in (B) (n = 3). (F) Quantification of the western blots in (E) (n = 3). (D and G) Cell growth assay by crystal violet staining in PC9 (D) and H1975 (G) cells expressing Pik3caWT, Pik3caMUT or none (parental). Means of three replicates are shown.
Figure 2
Figure 2
Disrupting the RAS-PI3K Interaction Impairs RAC1 Activation and Reduces Tumor Growth (A) Parental H1975 cells and H1975 cells expressing Pik3caWT or Pik3caMUT were starved overnight and stimulated with EGF (10 ng/mL) for the indicated times. Protein extracts were subjected to a RAC1 activation assay. One representative experiment from three is shown. (B) Quantification of western blot in (C). The ratio of RAC1-GTP to total RAC1 is shown, normalized to the value at time 0. (C and D) PC9 (C) and H1975 (D) parental cell lines and cells expressing either Pik3caWT or Pik3caMUT were injected into the flanks of nude mice (50,000 cells per mouse). The cells also contain a luciferase-expressing vector. Cells were allowed to grow, and tumor burden was measured by bioluminescence emission for the length of the experiment. (E and F) PC9 (E) and H1975 (F) parental cell lines and cells expressing either a wild-type RAC1 or a dominant-negative version (RAC1N17) were injected into the flanks of nude mice (50,000 cells per mouse). The cells also contain a luciferase-expressing vector. Cells were allowed to grow, and tumor burden was measured by bioluminescence emission for the length of the experiment. Means of three replicates are shown (C–F).
Figure 3
Figure 3
EGFR-Mutant Lung Tumors Lacking the RAS-PI3K Interaction Show Strongly Delayed Development (A) Volume of air remaining in mouse lungs after tamoxifen (2 weeks) and doxycycline diet at different time points (n = 26 for Pik3caWT/− and n = 21 for Pik3caMUT/−). (B) Representative examples of lungs visualized by micro-CT scan (left), ex-vivo view (middle), and histological sections stained with H&E after 18 weeks of a doxycycline diet. (C) Quantification of the number of tumor foci per lung after 18 weeks of a doxycycline diet from histological samples (n = 7 per group). (D) Quantification of the area of the lung occupied by tumor foci after 18 weeks of a doxycycline diet from histological samples (n = 7 per group). (E) Representative examples of proliferation in tumor samples visualized by Ki-67 staining. Scale bar, 100 μm. (F) Quantification of proliferation by Ki-67 staining (n = 6 per group). (G) Survival assay. The endpoint was dictated by defined welfare severity limits: moderately increased respiratory rate and/or moderately hunched appearance (n = 11 for Pik3caWT/Flox, n = 11 for Pik3caWT/−, and n = 15 for Pik3caMUT/−).
Figure 4
Figure 4
Removal of the RAS-PI3K Interaction Causes Major Regression of Established EGFR-Mutant Lung Tumors (A) Volume of air remaining in the lungs of mice after a doxycycline diet at different time points with (Pik3caWT/− and Pik3caMUT/−) or without (Pik3caWT/Flox and Pik3caMUT/Flox) 2 weeks of tamoxifen treatment starting at week 11. Animal numbers are n = 17 (Pik3caWT/Flox) and n = 15 (Pik3caMUT/Flox) from week 0 to week 11 and n = 7 (Pik3caWT/Flox), n = 9 (Pik3caMUT/Flox), n = 10 (Pik3caWT/−), and n = 6 (Pik3caMUT/−) from week 13 to the end of the experiment. (B) Representative examples of micro-CT scans (left three columns) and histological sections stained with H&E (right panel) after 18 weeks of a doxycycline diet. Scale bar, 1 mm. (C) Number of tumor foci (nodules) per lung quantified from histological samples (n = 7 per group). (D) Representative examples of apoptosis visualized by TUNEL staining in histological samples. Scale bar, 100 μm. (E) Quantification of apoptosis by TUNEL staining (n = 20 for each group). (F) Representative examples of proliferation visualized by Ki-67 staining in histological samples. Scale bar, 100 μm. (G) Quantification of proliferation by Ki-67 staining (n = 20 for Pik3caWT/− and n = 19 for Pik3caMUT/−).

References

    1. Burns M.C., Sun Q., Daniels R.N., Camper D., Kennedy J.P., Phan J., Olejniczak E.T., Lee T., Waterson A.G., Rossanese O.W., Fesik S.W. Approach for targeting Ras with small molecules that activate SOS-mediated nucleotide exchange. Proc. Natl. Acad. Sci. USA. 2014;111:3401–3406. - PMC - PubMed
    1. Campa C.C., Ciraolo E., Ghigo A., Germena G., Hirsch E. Crossroads of PI3K and Rac pathways. Small GTPases. 2015;6:71–80sss. - PMC - PubMed
    1. Castellano E., Sheridan C., Thin M.Z., Nye E., Spencer-Dene B., Diefenbacher M.E., Moore C., Kumar M.S., Murillo M.M., Grönroos E. Requirement for interaction of PI3-kinase p110α with RAS in lung tumor maintenance. Cancer Cell. 2013;24:617–630. - PMC - PubMed
    1. Castellano E., Molina-Arcas M., Krygowska A.A., East P., Warne P., Nicol A., Downward J. RAS signalling through PI3-kinase controls cell migration via modulation of Reelin expression. Nat. Commun. 2016;7:11245. - PMC - PubMed
    1. Cox A.D., Fesik S.W., Kimmelman A.C., Luo J., Der C.J. Drugging the undruggable RAS: Mission possible? Nat. Rev. Drug Discov. 2014;13:828–851. - PMC - PubMed

Publication types