. 2018 Dec 26;25(13):3591-3602.e5.
doi: 10.1016/j.celrep.2018.12.011.

The TFAP2C-Regulated OCT4 Naive Enhancer Is Involved in Human Germline Formation

Affiliations

The TFAP2C-Regulated OCT4 Naive Enhancer Is Involved in Human Germline Formation

Di Chen et al. Cell Rep. .

Abstract

Human primordial germ cells (hPGCs) are the first embryonic progenitors in the germ cell lineage, yet the molecular mechanisms required for hPGC formation are not well characterized. To identify regulatory regions in hPGC development, we used the assay for transposase-accessible chromatin using sequencing (ATAC-seq) to systematically characterize regions of open chromatin in hPGCs and hPGC-like cells (hPGCLCs) differentiated from human embryonic stem cells (hESCs). We discovered regions of open chromatin unique to hPGCs and hPGCLCs that significantly overlap with TFAP2C-bound enhancers identified in the naive ground state of pluripotency. Using CRISPR/Cas9, we show that deleting the TFAP2C-bound naive enhancer at the OCT4 locus (also called POU5F1) results in impaired OCT4 expression and a negative effect on hPGCLC identity.

Keywords: OCT4; PGC; PGCLC; TFAP2C; enhancer; naive; pluripotency.


Conflict of interest statement

DECLARATION OF INTERESTS

The authors declare no competing interests.

Figures

Figure 1.
Figure 1.. Identifying Unique Regions of Open Chromatin in Human Germline Cells
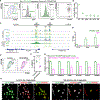
(A) Morphology of male (UCLA2) and female (UCLA1) primed hESCs, and iMeLCs used for ATAC-seq. Scale bars, 100 μm. (B) Male (UCLA2) and female (UCLA1) hPGCLCs were isolated as ITGA6/EPCAM double-positive cells at day 4 of aggregate differentiation. 82d and 89d hPGCs were isolated as TNAP/cKIT double-positive cells from a pair of embryonic testes and ovaries, respectively. (C–F) Screenshot of the ATAC-seq signal over PRDM1 (C), SOX17 (D), DDX4 (E), and DAZL (F) for male and female primed hESCs, iMeLCs, hPGCLCs, hPGCs, and embryonic somatic cells (soma.). Red dotted boxes highlight ATAC-seq peaks in hPGCLCs and/or hPGCs, but not in primed hESCs, iMeLCs, or embryonic somatic tissues. F, female; M, male. See also Figure S1.
Figure 2.
Figure 2.. Transcription Factor Motifs Enriched in Open Chromatin of Human Germline Cells
(A) Heatmap of ATAC-seq signals in embryonic somatic tissues, hESCs, iMeLCs, hPGCLCs, and hPGCs over germline cell-specific open chromatin regions (defined as enriched in hPGCLCs, hPGCs, or both) and corresponding transcription factor motifs enriched for those regions. (B) Heatmap of gene expression levels in hESCs, iMeLCs, hPGCLCs, and hPGCs for transcription factor family members with motifs identified as being enriched in germline cell-specific open chromatin. F, female; M, male. See also Figure S2.
Figure 3.
Figure 3.. Reacquisition of Ground-State Naive Pluripotency in Human Germline Cells
(A) Principal component analysis (PCA) of transcriptomes of ground state naive hESCs cultured in 5i/L/FA media, primed hESCs, iMeLCs, hPGCLCs, and hPGCs. Gene expression analysis was based on the RNA-seq data from Pastor et al. (2016) (5i/L/FA ground-state naive hESCs) and Chen et al. (2017) (primed hESCs, iMeLCs, hPGCLCs, and hPGCs). (B) Heatmap showing the expression of pluripotency genes in 5i/L/FA ground-state naive hESCs, primed hESCs, hPGCLCs, and hPGCs. The five hPGCs samples are 89d female, 103d female, 89d female, 89d female, and 59d male from left to right. F, female; M, male. (C) Venn diagram showing the overlap of germline cell-specific ATAC-seq regions with naive-specific and primed-specific regions identified by Pastor et al. (2018). Metaplot of the ATAC-seq signals in 5i/L/FA ground-state naive hESCs, hPGCLCs, and hPGCs and TFAP2C ChIP-seq signals in naive hESCs over regions defined from the Venn diagram. (D) Heatmap showing the ground-state naive hESCs ATAC-seq signals (Pastor et al., 2018) over hPGC-specific, hPGCLC-specific, and hPGC/hPGCLC-shared peaks. See also Figure S3.
Figure 4.
Figure 4.. TFAP2C Is Required for hPGCLC Specification and Expression of the Naive Transcription Factor KLF4
(A) Flow cytometry showing the induction of hPGCLCs at days 2 and 4 of aggregation differentiation using control and TFAP2C mutant hESCs. (B) Two independent TFAP2C mutant lines made from UCLA1 hESCs were used. hPGCLCs correspond to ITGA6/EPCAM double-positive cells. Three biological replicates were examined. Error bars represent SEM. (C) Expression of KLF4 in OCT4-positive hPGCLCs from day 1 through day 4 of aggregate differentiation in control and TFAP2C mutant UCLA1 hESC lines. The percentages of OCT4 and KLF4 double-positive cells are quantified at each stage and are represented by the orange color in the pie chart. Green, OCT4 single-positive cells; red, KLF4 single-positive cells; blue, DAPI-positive cells but negative for OCT4 and KLF4. Scale bars, 15 μm. The counting of all cell types is shown in Figure S4C. (D and E) Screenshot of the ATAC-seq signal near KLF4 (D). Red dashed box indicates a putative DNA regulatory element, which is closed in primed hESCs and iMeLCs but open in hPGCLCs and hPGCs. This DNA region is termed as the KLF4 element (KE). The germline cell-specific KE region with two AP2-binding sites (indicated by black arrows) is highlighted in (E). (F) ChIP-qPCR of KE using anti-TFAP2C antibodies in day 4 aggregates from UCLA1. Immunoglobulin G (IgG) was used as ChIP control. Two biological replicates for ChIP and two technical replicates for qPCR were performed. Control is a genomic region at the OCT4 locus without AP2-binding site. Error bars represent SEM. See also Figure S4.
Figure 5.
Figure 5.. The OCT4 NE Is Involved in hPGCLC Formation
(A) Flow cytometry of aggregates at day 4 of differentiation from H1 hESC line genetically modified to express GFP from the OCT4 locus (OCT4-GFP). hPGCLCs (ITGA6/EPCAM double-positive cells) are also positive for GFP. In contrast, non-hPGCLCs are GFP negative. Most OCT4-GFP-positive cells are positive for ITGA6/EPCAM. Three biological replicates were performed. (B) Summary of OCT4-GFP-positive cells during aggregate differentiation from days 1 to 4. The GFP-positive gate was set according to the GFP gate from (A). Two biological replicates were performed. (C) Screenshot of ATAC-seq and TFAP2C ChIP-seq signals showing three enhancers at the POU5F1 locus (encoding OCT4). Shaded boxes highlight the naive enhancer (NE), proximal enhancer (PE), and distal enhancer (DE) at the POU5F1 locus. DE deletion and NE deletion indicate genomic regions that were deleted by CRISPR/Cas9-mediated genome editing. Primers for ChIP-qPCR (P1–2, P3–4, P5–6) of NE and control regions are shown. (D) ChIP-qPCR using anti-TFAP2C antibodies in day 4 aggregates from the UCLA1 line. IgG was used as a ChIP control. Two biological replicates for ChIP and two technical replicates for qPCR were performed. Primer (P) locations at the POU5F1 locus are shown in (C). Error bars represent SEM. (E) Flow cytometry of control and OCT4 NE deletion day 4 aggregates from the UCLA1 hESCs. hPGCLCs correspond to the ITGA6/EPCAM double-positive cells (n = 3 biological replicates). (F) Quantification of hPGCLC percentages from (E). t test was applied. Error bars represent SEM. (G) Expression of germ cell genes in ITGA6/EPCAM double-positive hPGCLCs from control and OCT4 NE deletion samples at day 4 of aggregate differentiation from UCLA1 hESCs (n = 2 biological replicates). Error bars represent SEM. (H) Immunofluorescence of OCT4 (green) and TFAP2C (red) in control and OCT4 NE deletion aggregates at day 4 of differentiation from UCLA1 hESCs (n = 2 biological replicates). hPGCLCs correspond to OCT4/TFAP2C double-positive cells. Scale bars, 15 μm. See also Figure S5.

References

    1. Adey A, Morrison HG, Asan, Xun X, Kitzman JO, Turner EH, Stackhouse B, MacKenzie AP, Caruccio NC, Zhang X, and Shendure J (2010). Rapid, low-input, low-bias construction of shotgun fragment libraries by high-density in vitro transposition. Genome Biol. 11, R119. - PMC - PubMed
    1. Anders S, Pyl PT, and Huber W (2015). HTSeq—a Python framework to work with high-throughput sequencing data. Bioinformatics 31, 166–169. - PMC - PubMed
    1. Buenrostro JD, Giresi PG, Zaba LC, Chang HY, and Greenleaf WJ (2013). Transposition of native chromatin for fast and sensitive epigenomic profiling of open chromatin, DNA-binding proteins and nucleosome position. Nat. Methods 10, 1213–1218. - PMC - PubMed
    1. Chen D, Liu W, Lukianchikov A, Hancock GV, Zimmerman J, Lowe MG, Kim R, Galic Z, Irie N, Surani MA, et al. (2017). Germline competency of human embryonic stem cells depends on eomesodermin. Biol. Reprod 97, 850–861. - PMC - PubMed
    1. Choi HW, Joo JY, Hong YJ, Kim JS, Song H, Lee JW, Wu G, Schöler HR, and Do JT (2016). Distinct enhancer activity of Oct4 in naive and primed mouse pluripotency. Stem Cell Reports 7, 911–926. - PMC - PubMed

Publication types

MeSH terms