. 2018 Dec 26;25(13):3647-3660.e2.
doi: 10.1016/j.celrep.2018.11.095.

Altered γ-Secretase Processing of APP Disrupts Lysosome and Autophagosome Function in Monogenic Alzheimer's Disease

Affiliations

Altered γ-Secretase Processing of APP Disrupts Lysosome and Autophagosome Function in Monogenic Alzheimer's Disease

Christy O Y Hung et al. Cell Rep. .

Abstract

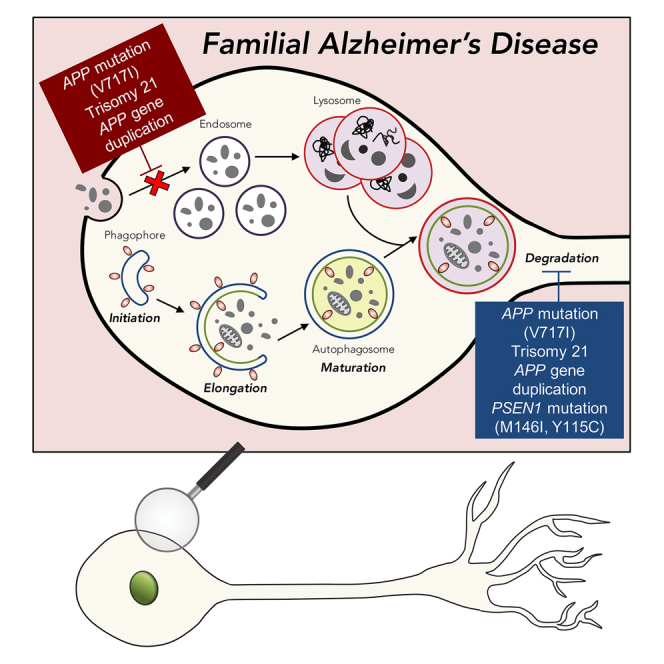
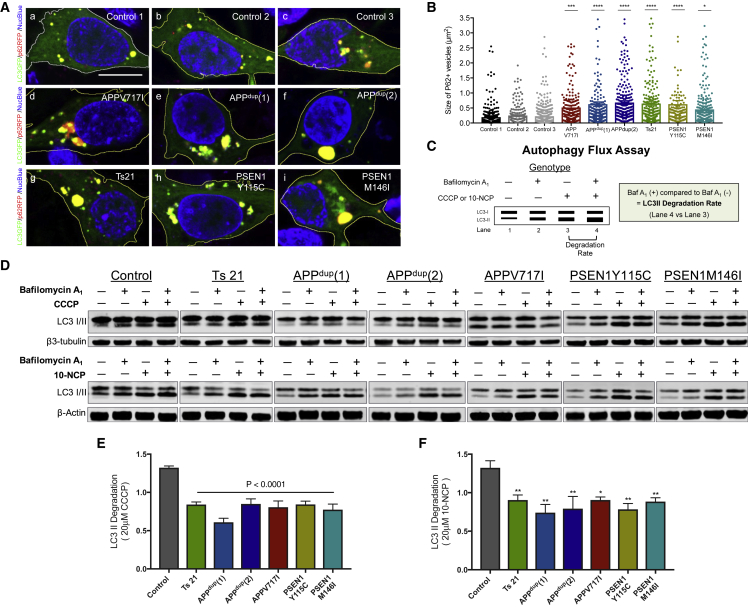
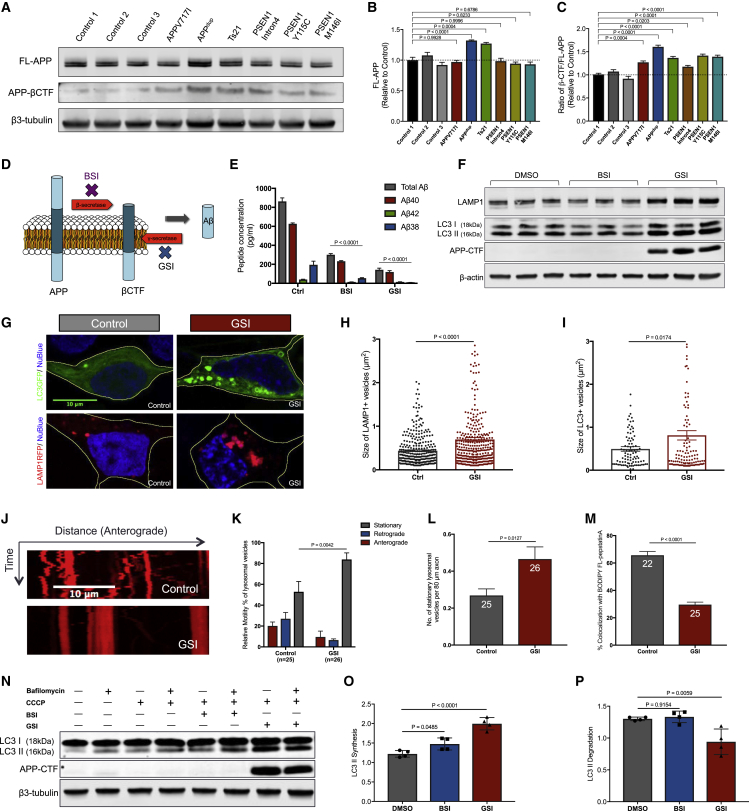
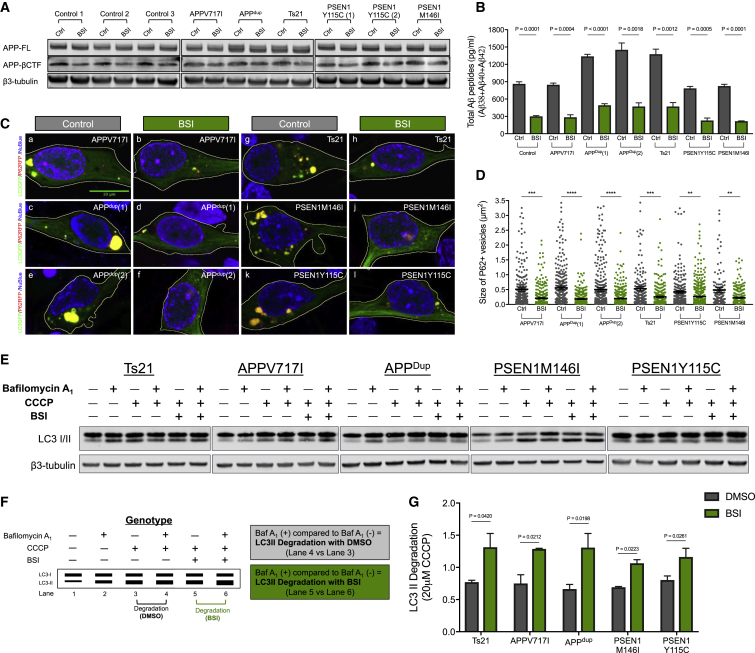
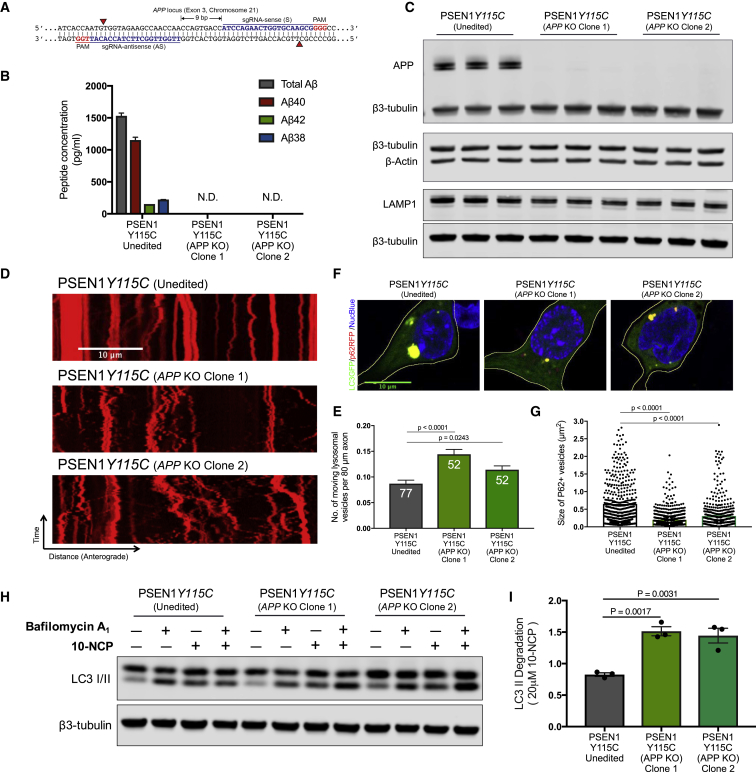
Abnormalities of the endolysosomal and autophagy systems are found in Alzheimer's disease, but it is not clear whether defects in these systems are a cause or consequence of degenerative processes in the disease. In human neuronal models of monogenic Alzheimer's disease, APP and PSEN1 mutations disrupt lysosome function and autophagy, leading to impaired lysosomal proteolysis and defective autophagosome clearance. Processing of APP by γ-secretase is central to the pathogenic changes in the lysosome-autophagy system caused by PSEN1 and APP mutations: reducing production of C-terminal APP by inhibition of BACE1 rescued these phenotypes in both APP and PSEN1 mutant neurons, whereas inhibition of γ-secretase induced lysosomal and autophagic pathology in healthy neurons. Defects in lysosomes and autophagy due to PSEN1 mutations are rescued by CRISPR-knockout of APP. These data demonstrate a key role for proteolysis of the C-terminal of APP by γ-secretase in neuronal dysfunction in monogenic Alzheimer's disease.

Keywords: Alzheimer’s disease; autophagy; axonal transport; endosome; live-cell imaging; lysosome.


Figures

None
Graphical abstract
Figure 1
Figure 1
Alzheimer’s Disease Mutations in APP, but Not PSEN1, Result in Early Endosome Abnormalities in Human Cortical Neurons (A) Representative images of neurons generated from three independent non-demented controls, APP (dup), Ts21, and APP V717I and PSEN1 mutants (Y115C, M146I, or Intron 4) induced pluripotent stem cells (iPSCs). Scale bar, 10 μm. (B and C) Significant increases in the size (B) and number per unit area (C) of Rab5A-GFP positive endosomes in APP but not PSEN1 mutant neurons, compared with non-demented controls (one-way ANOVA with Tukey correction between controls and Alzheimer’s Disease [AD] neurons in each case). Rab5A-GFP+ vesicle size measures in (B) were from three independent experiments, including an independent neural induction in each case. Total number of vesicles measured (n): 260 (Control 1), 654 (Control 2), 265 (Control 3), 472 (APP V717I), 574 (APPdup), 700 (Ts21), 250 (PSEN1 Intron4), 355 (PSEN1 Y115C), and 620 (PSEN1 M146I). Number of vesicles per unit cytoplasmic area (C) was measured in three independent experiments (n = 3), with total numbers of cells indicated within each bar. (D–F) Representative western blots of Rab5A, LAMP1, and neuron-specific β3-tubulin in three independent control and AD neurons are shown (D). Levels of Rab5A (E) and LAMP1 (F) were calculated relative to β3-tubulin from three independent experiments (n = 3), including an independent neural induction in each case. Error bars, SEM. See also Figure S1.
Figure 2
Figure 2
Accumulation of Enlarged Late Endosomes and Lysosomes in Human Neurons with PSEN1 or APP Mutations (A) Representative images of neurons expressing a LAMP1-RFP fusion protein (red; blue, nuclei labeled with NucBlue). Scale bar, 10 μm. (B and C) Significant increases in the size (B) and number per unit area (C) of LAMP1-RFP-positive late endosomes and/or lysosomes in APP and PSEN1 mutant (Y115C, M146I) neurons, but not PSEN1 Intron 4 neurons, compared with non-demented controls (one-way ANOVA with Tukey correction between controls and AD neurons in each case). LAMP1-RFP+ vesicle size measures in (B) were from three independent experiments, including an independent neural induction in each case. Total number of vesicles measured (n): 484 (Control 1), 341 (Control 2), 50 (Control 3), 199 (APP V717I), 561 (APPdup), 579 (Ts21), 187 (PSEN1 Intron4), 321 (PSEN1 Y115C), 358 (PSEN1 M146I). Number of vesicles per unit cytoplasmic area (C) was measured in three independent experiments (n = 3), with total numbers of cells indicated within each bar. Error bars, SEM. See also Figure S2.
Figure 3
Figure 3
Impaired Axonal Lysosome Transport and Proteolysis Deficits in Human APP and PSEN1 Mutant Neurons (A) Representative kymographs showing transport of lysosomes labeled with LysoTracker Red DND 99. Scale bar, 10 μm. (B) Significant increase in the average size of axonal lysosome in both APP and PSEN1 mutant (Y115C, M146I) neurons, compared with non-demented control (one-way ANOVA with Tukey correction between control and AD neurons in each case). Total number of axons measured (n): 35 (Control), 32 (APP V717I), 25 (APPdup), 45 (Ts21), 33 (PSEN1 Y115C), and 28 (PSEN1 M146I). Error bars, SEM. (C) Significant reduction in lysosome motility in both anterograde and retrograde directions in both APP and PSEN1 mutant neurons, compared with controls (one-way ANOVA with Tukey correction between controls and AD neurons in each case). Total number of axons measured (n): 35 (Control 1), 32 (Control 2), 32 (APP V717I), 25 (APPdup), 45 (Ts21), 33 (PSEN1 Y115C), and 28 (PSEN1 M146I). Error bars, SEM. (D) Proteolysis deficits in both APP and PSEN1 mutant (Y115C, M146I) neurons, as detected by live imaging of iPSC-derived cortical neurons co-labeled with 100 nM LysoTracker Red DND-99 and BODIPY-FL-pepstatinA. Scale bar, 10 μm. (E) Significant reduction in the percentage of lysosomes that contained CatD-positive signals in both APP and PSEN1 mutant (Y115C, M146I) neurons, compared with non-demented controls (one-way ANOVA with Tukey correction between controls and AD neurons in each case). Axons were measured in three independent experiments, with total numbers of axons (n) indicated within each bar. Error bars, SEM. See also Figures S3 and S4.
Figure 4
Figure 4
Defective Degradation of Autophagosomes in Human APP and PSEN1 Mutant Neurons (A) Increased size of autophagosomes in human cortical excitatory neurons with APP and PSEN1 mutations, as detected by live imaging of iPSC-derived neurons co-expressing p62-RFP (red) and a LC3-GFP (green) fusion proteins (blue, nuclei labeled with NucBlue). Scale bar, 10 μm. (B) Significant increases in the size of p62-RFP-positive autophagosomes in both APP and PSEN1 mutant (Y115C, M146I) neurons, compared with non-demented controls (one-way ANOVA with Tukey correction between controls and AD neurons in each case). p62-RFP+ vesicle size measures in (B) were from three independent experiments, including an independent neural induction in each case. Total number of vesicles measured (n): 324 (Control 1), 183 (Control 2), 448 (Control 3), 376 (APP V717I), 355 (APPdup) (1), 350 (APPdup) (2), 372 (Ts21), 225 (PSEN1 Y115C), and 399 (PSEN1 M146I). Error bars, SEM. (C) Diagram of the autophagy flux assay. Autophagic degradation was calculated by comparing LC3-II levels following treatment with autophagy activators (CCCP or 10-NCP) in the presence (lane 4) or absence (lane 3) of bafilomycin A1 (i.e., lane 4 versus lane 3). (D–F) Autophagosome degradation was significantly reduced in both APP and PSEN1 mutant (Y115C or M146I) neurons, compared with non-demented controls, as calculated from the western blot analysis (two-tailed t test between controls and AD neurons). Representative western blots of LC3I/II and neuron-specific β3-tubulin from neurons derived from three independent non-demented controls and monogenic AD iPSCs are shown (D). Autophagosome degradation following autophagy induction with either CCCP (20 μM) (E) or 10-NCP (20 μM) (F) in the absence or presence of bafilomycin A1 (200 nM) was calculated from four independent experiments (n = 4), including an independent neural induction in each case. Error bars, SEM.
Figure 5
Figure 5
Gamma-Secretase Inhibition Disrupts Function of the Lysosomal-Autophagic System in Human Neurons (A–C) APP-β-CTF levels are significantly increased in human cortical excitatory neurons with APP and PSEN1 mutations (intron 4, Y115C, or M146I), compared with non-demented controls (two-tailed t test between controls and AD neurons). Representative western blots of FL-APP, APP-βCTF, and neuron-specific β3-tubulin in three independent control and AD neurons are shown (A). Levels of FL-APP (B) and ratio of βCTF/FL-APP (C) were calculated relative to β3-tubulin and normalized to non-demented controls (n = 3). Error bars, SEM. (D) Schematic of APP processing to generate Aβ peptides. (E and F) Multiplexed ELISA (MSD) quantification of extracellular Aβ peptides (E) from non-demented control neurons following treatment with BSI shows significant reduction in the production of Aβ38, Aβ40, and Aβ42, compared to Ctrl. Similarly, GSI significantly reduces extracellular Aβ. Representative western blots of LAMP1, LC3I/II, APP-CTF, and neuron-specific β3-tubulin are shown (F). Neurons treated from day 65 to day 85 with the indicated compounds at a final concentration of 5 μM. Data were calculated from three independent experiments (n = 3), including an independent neural induction in each case. Error bars, SEM. (G) Live imaging of iPSC-derived neurons expressing LAMP1-RFP (red; blue, nuclei labeled with NucBlue) or LC3-GFP fusion protein (green; blue, nuclei labeled with NucBlue). Scale bar, 10 μm. (H and I) Significant increases in the size of (H) LAMP1-RFP-positive late endosomes and/or lysosomes and (I) LC3-GFP-positive autophagosomes in non-demented control neurons treated with GSI (two-tailed t test between DMSO and GSI-treated neurons in each case). LAMP1-RFP+ and LC3-GFP+ vesicle size measures in (H) or (I) were from three independent experiments, including an independent neural induction in each case. Total number of vesicles measured in (H) (n): 326 (Ctrl), 350 (GSI). Total number of vesicles measured in (I) (n): 90 (Ctrl), 111 (GSI). Error bars, SEM. (J) Impaired axonal lysosome transport in non-demented control human neurons treated with GSI, as detected by live imaging of iPSC-derived neuron labeled with 100 nM LysoTracker Red DND-99. Scale bar, 10 μm. (K and L) Significant reduction in lysosome motility (K) and number of stationary lysosomal vesicles (L) in non-demented control human neurons treated with GSI (two-tailed t test between DMSO and GSI-treated neurons in each case). Total number of axons measured in (H) (n): 25 (Ctrl), 26 (GSI). Axons were measured in three independent experiments, with total numbers of axons (n) indicated within each bar in (L). Error bars, SEM. (M) Significant reduction in the percentage of lysosomes that contained CatD-positive signals in non-demented control human neurons treated with GSI (two-tailed t test between DMSO and GSI-treated neurons in each case). Axons were measured in three independent experiments, with total numbers of axons (n) indicated within each bar. Error bars, SEM. (N–P) Autophagosome degradation was significantly reduced in non-demented control human neurons treated with GSI, as detected by western blot analysis (two-tailed t test between DMSO and GSI-treated neurons). Representative western blots of LC3I/II and neuron-specific β3-tubulin in non-demented control human neurons treated with DMSO, BSI, or GSI are shown (N). Rates of autophagosome (O) synthesis and (P) degradation following autophagy induction with CCCP (20 μM) in the absence or presence of bafilomycin A1 (200 nM) were calculated relative to β3-tubulin from four independent experiments (n = 4). Error bars, SEM.
Figure 6
Figure 6
Dysfunction in the Lysosome-Autophagy System in Familial AD Neurons Is Reversed by β-Secretase Inhibition (A) BSI reduces APP-βCTF level in all genotypes. Representative western blots of FL-APP, APP-βCTF, and neuron-specific β3-tubulin are shown. (B) Multiplexed ELISA quantification of extracellular Aβ peptides from monogenic AD neurons following treatment with BSI shows significant reduction in the production of total Aβ peptides, compared to controls (two-tailed t test between DMSO and BSI-treated neurons in each case). Neurons treated between from day 65 to day 85 with BSI at a final concentration of 5 μM. Data were calculated from three independent experiments (n = 3), including an independent neural induction in each case. Error bars, SEM. (C) Live imaging of iPSC-derived neurons co-expressing p62-RFP (red) and LC3-GFP (green) fusion proteins (blue, nuclei labeled with NucBlue). Scale bar, 10 μm. (D) Significant reductions in the size of p62-RFP-positive autophagosomes in monogenic AD neurons treated with BSI, compared with DMSO-treated controls (two-tailed t test between DMSO and BSI-treated neurons in each case). p62-RFP+ vesicle size measures in (C) were from three independent experiments, including an independent neural induction in each case. Total number of vesicles measured (n): 558 (APP V717I Ctrl), 396 (APP V717I BSI), 479 (APPdup(1) Ctrl), 484 (APPdup(1) BSI), 574 (APPdup(2) Ctrl), 541 (APPdup(2) BSI), 384 (Ts21 Ctrl), 399 (Ts21 BSI), 628 (PSEN1 Y115C Ctrl), 614 (PSEN1 Y115C BSI), 240 (PSEN1 M146I Ctrl), and 291 (PSEN1 M146I BSI). Error bars, SEM. (E) Representative western blots of LC3I/II and neuron-specific β3-tubulin in familial AD neurons treated with DMSO or BSI are shown. (F and G) Schematic of the autophagy flux assays (F) used for this set of comparisons (E). Autophagosome degradation (basal level) was calculated by comparing LC3-II levels following treatment with CCCP in the presence (lane 4) or absence (lane 3) of bafilomycin A1 (i.e., lane 4 versus lane 3). Similarly, autophagosome degradation (treated with BSI) was calculated by comparing LC3-II levels following treatment with CCCP in the presence (lane 5) or absence (lane 6) of bafilomycin A1 (i.e., lane 5 versus lane 6). (G) LC3-II levels were calculated relative to β3-tubulin from three independent experiments (n = 3) (two-tailed t test between DMSO and BSI-treated neurons in each case). Error bars, SEM. See also Figure S5.
Figure 7
Figure 7
Autophagy Defects in PSEN1 Mutant Neurons Are Rescued by CRISPR Knockout of APP (A) Double nickase strategy with sense (S) and antisense (AS) single guide RNAs (sgRNAs) separated by 9 bp at exon 3 of the APP locus on chromosome 21. Red arrows indicate the cut sites of Cas9D10A nickase, which generates 5′ overhangs at target sites. (B) CRISPR targeting of both alleles of APP was confirmed by the complete absence of extracellular Aβ peptides generated by PSEN1 Y115C;APP knockout (KO) neurons, compared with isogenic PSEN1 Y115C neurons. Multiplexed ELISA quantification of extracellular Aβ peptides from unedited and two independent clones of APP KO neurons from three independent experiments (n = 3). (C) APP protein was not detected in two independent clones of PSEN1 Y115C; APP KO neurons, confirming complete knockout of both APP alleles. In contrast, total LAMP1 levels are decreased in two independent clones of PSEN1 Y115C;APP KO neurons (90 days post-neural induction), compared with unedited PSEN1 Y115C neurons (two-tailed t test between unedited and KO neurons). Representative western blots of APP, LAMP1, β-actin, and neuron-specific β3-tubulin unedited isogenic PSEN1 Y115C and two independent clones of PSEN1 Y115C;APP KO neurons. (D and E) Live imaging of iPSC-derived neurons labeled with 100 nM LysoTracker Red DND-99 (D). Scale bar, 10 μm. Significant increases in the number of moving lysosomal vesicles (E) in two independent clones of PSEN1 Y115C;APP KO neurons, compared with unedited isogenic PSEN1 Y115C neurons (two-tailed t test between unedited and KO neurons). Axons were measured in three independent experiments, with total numbers of axons (n) indicated within each bar. Error bars, SEM. (F and G) Significant decreases in the size of p62-RFP-positive autophagosomes (F) in two independent clones of PSEN1 Y115C;APP KO neurons, compared with unedited isogenic neurons (two-tailed t test between unedited and KO neurons) (G). p62-RFP+ vesicle size measures in (G) were from three independent experiments, including an independent neural induction in each case. Total number of vesicles measured (n): 799 (Unedited;PSEN1 Y115C), 840 (PSEN1 Y115C;APP KO Clone 1), and 602 (PSEN1 Y115C;APP KO Clone 2). Error bars, SEM. (H and I) Impaired autophagosome degradation was significantly rescued in two independent clones of PSEN1 Y115C;APP KO neurons, compared with unedited isogenic neurons (two-tailed t test between unedited and KO neurons). Representative western blots of LC3I/II and neuron-specific β3-tubulin in two independent clones of PSEN1 Y115C;APP KO neurons are shown (H). (I) LC3-II levels following autophagy induction with 10-NCP (20 μM) in the absence or presence of bafilomycin A1 (200 nM) were calculated relative to β3-tubulin from three independent experiments (n = 3). Error bars, SEM.

References

    1. Acx H., Serneels L., Radaelli E., Muyldermans S., Vincke C., Pepermans E., Müller U., Chávez-Gutiérrez L., De Strooper B. Inactivation of γ-secretases leads to accumulation of substrates and non-Alzheimer neurodegeneration. EMBO Mol. Med. 2017;9:1088–1099. - PMC - PubMed
    1. Bertram L., Tanzi R.E. Thirty years of Alzheimer’s disease genetics: the implications of systematic meta-analyses. Nat. Rev. Neurosci. 2008;9:768–778. - PubMed
    1. Cataldo A.M., Peterhoff C.M., Troncoso J.C., Gomez-Isla T., Hyman B.T., Nixon R.A. Endocytic pathway abnormalities precede amyloid β deposition in sporadic Alzheimer’s disease and Down syndrome: differential effects of APOE genotype and presenilin mutations. Am. J. Pathol. 2000;157:277–286. - PMC - PubMed
    1. Cataldo A., Rebeck G.W., Ghetri B., Hulette C., Lippa C., Van Broeckhoven C., van Duijn C., Cras P., Bogdanovic N., Bird T. Endocytic disturbances distinguish among subtypes of Alzheimer’s disease and related disorders. Ann. Neurol. 2001;50:661–665. - PubMed
    1. Cataldo A.M., Mathews P.M., Boiteau A.B., Hassinger L.C., Peterhoff C.M., Jiang Y., Mullaney K., Neve R.L., Gruenberg J., Nixon R.A. Down syndrome fibroblast model of Alzheimer-related endosome pathology: accelerated endocytosis promotes late endocytic defects. Am. J. Pathol. 2008;173:370–384. - PMC - PubMed

Publication types

MeSH terms

Substances