. 2018 Dec 26;25(13):3733-3749.e8.
doi: 10.1016/j.celrep.2018.11.101.

REV-ERBα Regulates TH17 Cell Development and Autoimmunity

Affiliations

REV-ERBα Regulates TH17 Cell Development and Autoimmunity

Mohammed Amir et al. Cell Rep. .

Abstract

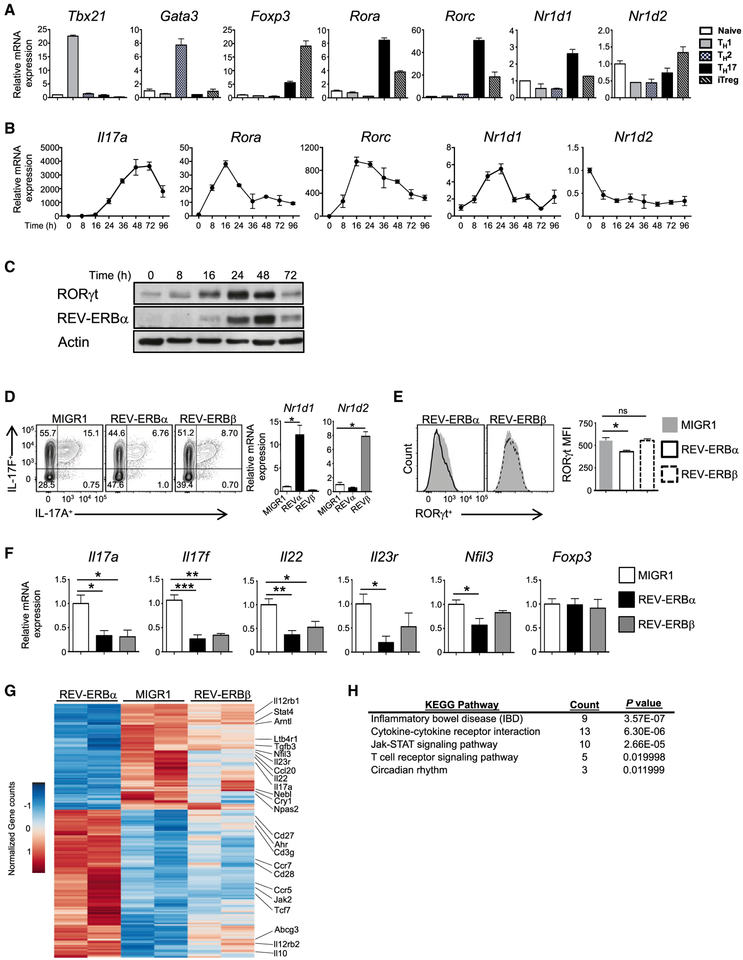
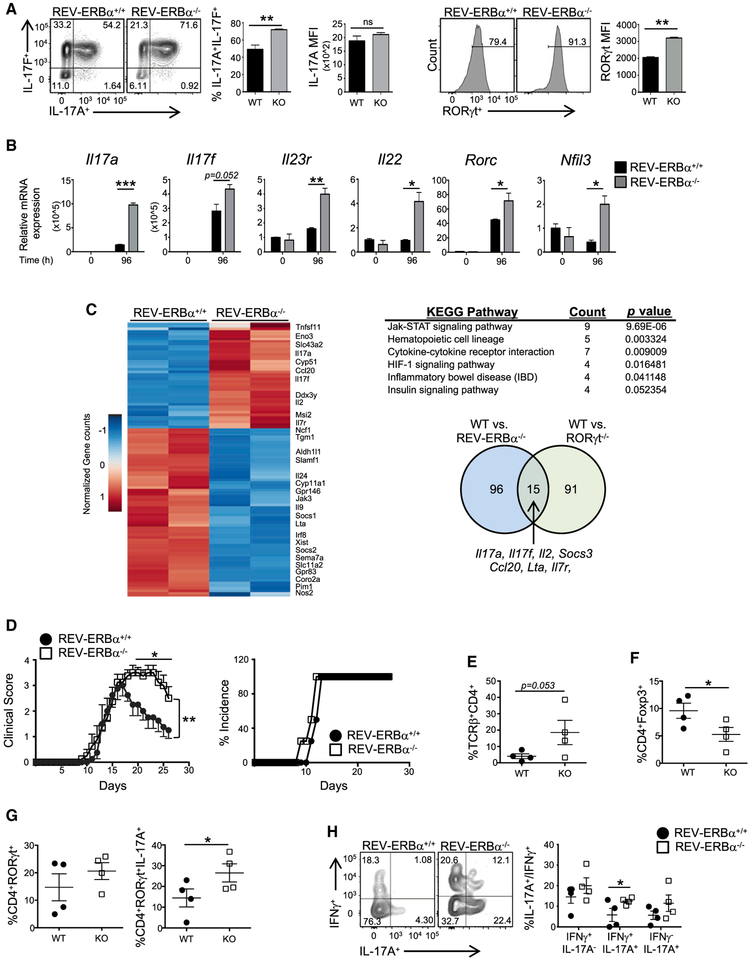
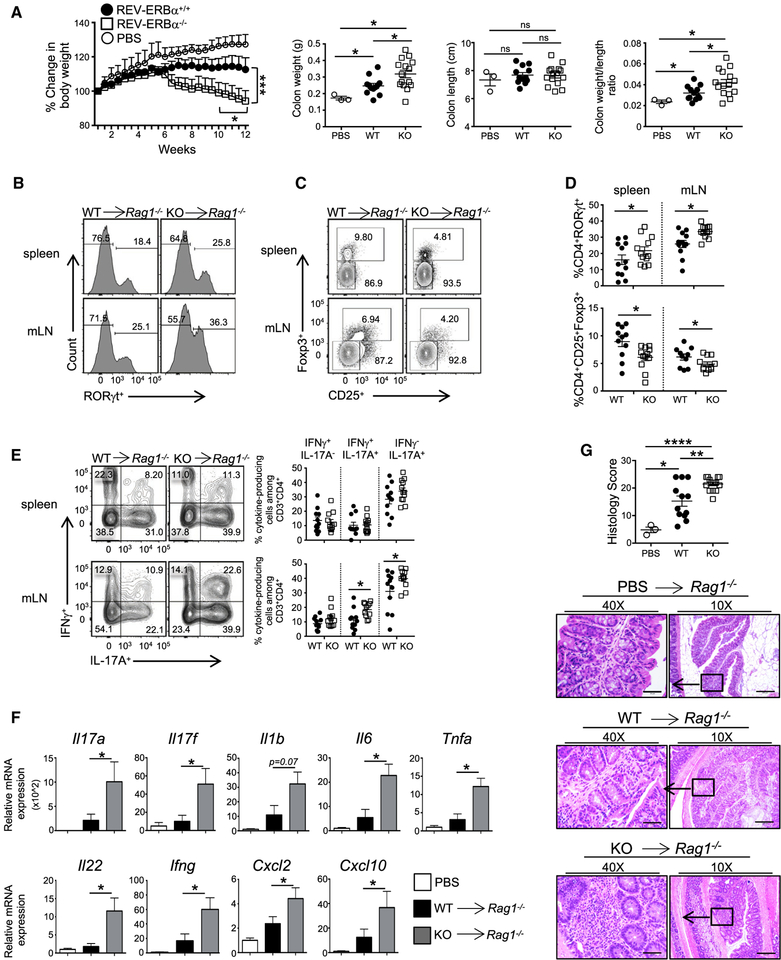
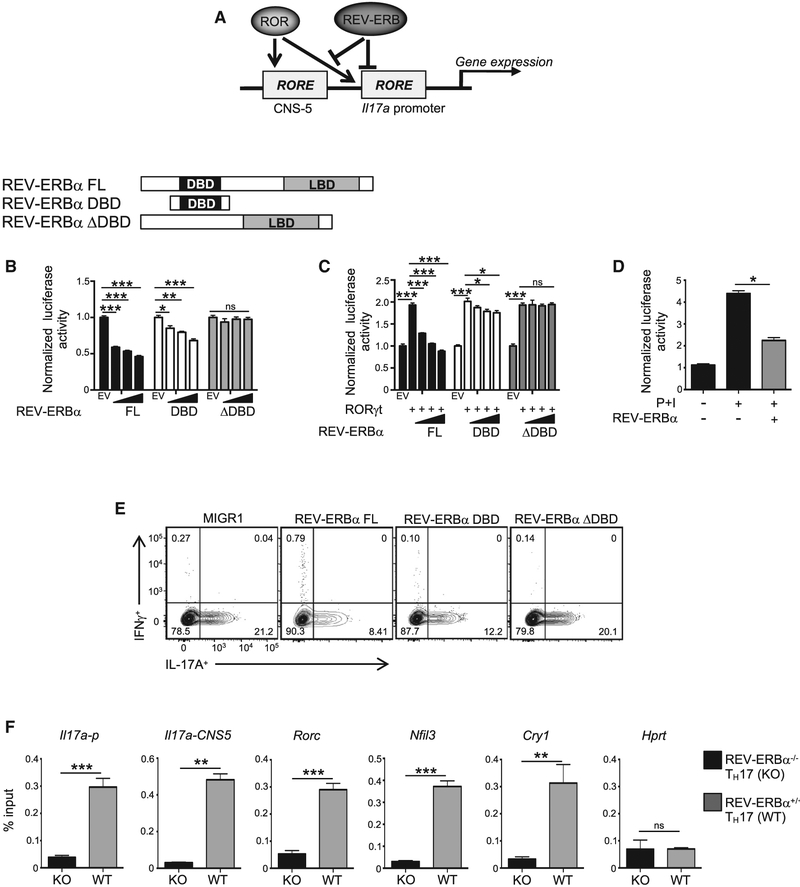
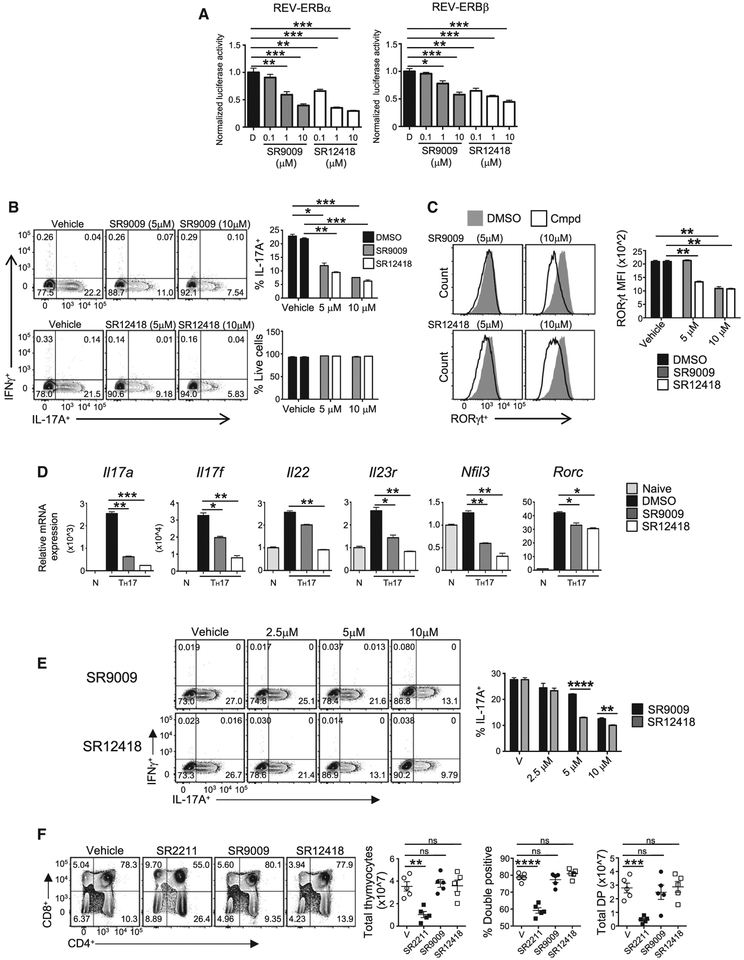
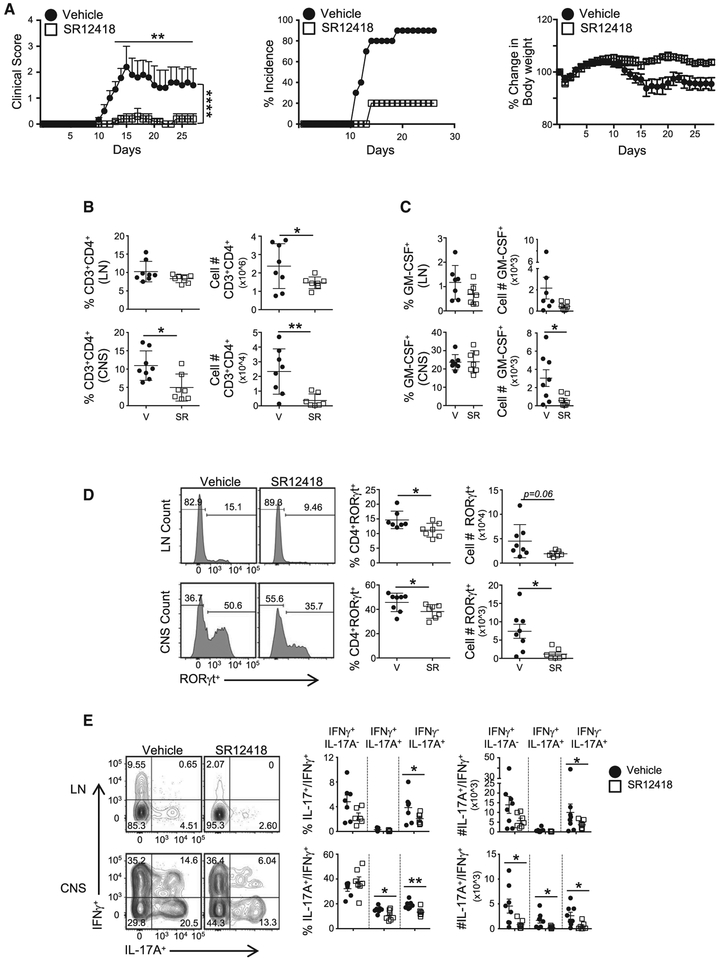
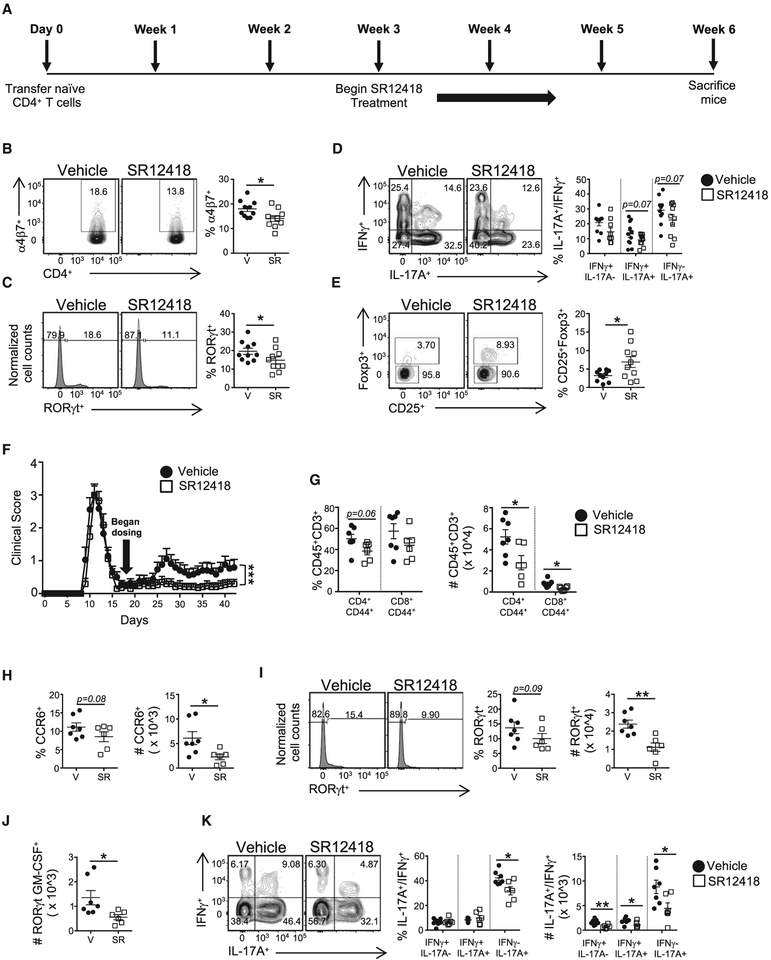
RORγt is well recognized as the lineage-defining transcription factor for T helper 17 (TH17) cell development. However, the cell-intrinsic mechanisms that negatively regulate TH17 cell development and autoimmunity remain poorly understood. Here, we demonstrate that the transcriptional repressor REV-ERBα is exclusively expressed in TH17 cells, competes with RORγt for their shared DNA consensus sequence, and negatively regulates TH17 cell development via repression of genes traditionally characterized as RORγt dependent, including Il17a. Deletion of REV-ERBα enhanced TH17-mediated pro-inflammatory cytokine expression, exacerbating experimental autoimmune encephalomyelitis (EAE) and colitis. Treatment with REV-ERB-specific synthetic ligands, which have similar phenotypic properties as RORγ modulators, suppressed TH17 cell development, was effective in colitis intervention studies, and significantly decreased the onset, severity, and relapse rate in several models of EAE without affecting thymic cellularity. Our results establish that REV-ERBα negatively regulates pro-inflammatory TH17 responses in vivo and identifies the REV-ERBs as potential targets for the treatment of TH17-mediated autoimmune diseases.

Keywords: IL-17A; REV-ERB; RORγt; SR9009; T cells; Th17; autoimmunity; circadian.


Conflict of interest statement

DECLARATION OF INTERESTS

The authors declare no competing financial interests.

Figures

Figure 1.
Figure 1.. The REV-ERBs Inhibit TH17 Cell Development
(A) Quantitative real-time PCR analysis ofThelper cell lineage-specific transcription factorsT-bet (Tbx21), Gata3, Foxp3, RORα (Rora), RORγt (Rorc), REV-ERBα (Nrldl), and REV-ERBβ (Nr1d2) under TH1, TH2, TH17, and inducible T regulatory cell (iTreg) conditions at 48 hr after T cell-activation compared to naive CD4+ T cells (n = 3). (B) Quantitative real-time PCR of Il17a, Rora, Rorc, Nrldl, and Nr1d2 expression during TH17 cell differentiation. Data represent mean ± SEM (n = 3). (C) Immunoblot analysis of REV-ERBα and RORγt expression during TH17 cell differentiation (n = 4). (D) FACS analysis of IL-17A and IL-17F expression in TH17 cells transduced with empty vector (MIGR1), REV-ERBα, or REV-ERBβ. Cells were gated on live, GFP+ cells. Quantitative real-time PCR analysis of REV-ERBα and REV-ERBβ expression from sorted GFP+ TH17 cells transduced with MIGR1, REV-ERBα, or REV-ERBβ (n = 4). (E) FACS analysis of RORγt expression from T cell cultures shown in (D). Graph (right) indicates median fluorescent intensity (MFI) of RORγt expression in the FACS plots. (F) Quantitative real-time PCR of sorted GFP+ cells from (D) (n = 3). (G) Heatmap of differentially expressed genes in TH17 cells (false discovery rate [FDR], <0.05). (H) KEGG pathway analysis of genes differentially expressed between MIGR1-, REV-ERBα–, and REV-ERBβ-overexpressing TH17 cells. p-actin was used as the internal control for quantitative real-time PCR. *p < 0.05, **p < 0.01, and ***p < 0.001 determined using Student’s t test. ns, not significant (p > 0.05).
Figure 2.
Figure 2.. Loss of REV-ERBα Leads To Increased TH17-Mediated Autoimmunity
(A) FACSanalysisfromT|-|17culturesderived from REV-ERBα+/+ (WT) and REV-ERBα−/− (KO) mice. Graphs indicate percent IL-17A+IL-17F+ cells(top) and MFI of RORγt expression in the FACS plots (bottom) (n = 4). (B) Quantitative real-time PCR of TH17-mediated cytokines in TH17 cell cultures from WT and KO mice. β-actin was used as the internal control (n = 3). (C) Heatmap of differentially expressed genes between WT and KO TH17 cells. KEGG pathway analysis of genes differentially expressed between WT and KO TH17 cells. Venn diagram depicting the numbers of unique and shared genes differentially regulated in WT/KO and WT/RORγ−/− TH17 cells (FDR, <0.05). (D) Clinical EAE scores (left) and disease incidence (right) from WT and KO mice subjected to MOG-induced EAE. (E and F) Graphs summarizing the frequency of TCRβ+CD4+ cells (E) and Foxp3+ cells in the CNS of mice (F). (G) Graph representing FACS analysis of RORγt expression (left) and total IL-17Aexpression in RORγt+ cells (right) in theTCRp+CD4+ cells in the CNS of WT and KO mice. (H) FACS analysis and graph depicting the frequency of IL-17A+IFNγ, IL-17A+IFNγ+, and IL-17AIFNγ+ cells in the CNS ofWT and KO mice. Cellsweregated on live, CD45+TCRp+CD4+ cells. Each symbol representsan individual mouse (n = 4/group). Data represent mean ± SEM and are representative of two separate independent experiments generating similar results. Two-way ANOVA (clinical score) and Student’sttests were performed forstatistical analysis. *p < 0.05, **p < 0.01, ***p < 0.001.
Figure 3.
Figure 3.. Loss of REV-ERBα in T Cells Exacerbates Colitis
(A) Percent change in body weight, colon weights, colon lengths, and colon weight versus colon length ratios of Rag1−/− recipient mice over 12 weeks post- adoptive transfer of WT, KO, or control (no cells, PBS) T cells. (B-D) FACS plots demonstrating frequencies of (B and D) RORγt+ and (C and D) CD25+Foxp3+ cells in the spleens and mesenteric lymph nodes (mLN) of recipient mice at the termination of the experiment. (E) FACS analysis and frequencies of IL-17A+IFNγ, IL-17A+IFNγ+, and IL-17AIFNγ+ cells in the spleens and mLNs of recipient mice. Cells were gated on live, CD45+CD3+CD4+ cells. (F) Quantitative real-time PCR analysis of cytokines and chemokines expressed in the proximal colon from Rag1−/− mice receiving PBS, WT, or KO CD4+ T cells. 18s was used as the internal control. (G) Histology scores from colon and representative hematoxylin and eosin stained proximal colon sections from Rag1−/− recipient mice12 weeks after transfer of naive CD4+ T cells. (×10 magnification, scale bars represent 200 mm; ×40 magnification, scale bars represent 50 mm) (n = 13 for WT, n = 15 for KO, and n = 3 for PBS). Data represent mean ± SEM. Two-way ANOVA (body weight) and Student’s t tests were performed for statistical analysis. *p < 0.05, **p < 0.001, ***p < 0.001, ****p<0.0001.
Figure 4.
Figure 4.. REV-ERBα Competes with RORγt To Repress TH17 Cell Development
(A) Schematic demonstrating REV-ERBα and RORγt competition for the Il17a locus. (B) Schematic of REV-ERBα constructs. Cotransfection assays in HEK293 cells demonstrating full-length (FL) and REV-ERBα DBD dose-dependently sup-presses Il17a + CNS5 luciferase activity. EV refers to empty vector. (n = 5). (C) Cotransfection assay in HEK293 cellsdemonstratingthat FLand REV-ERBα DBD competeswith RORγt binding attheIl17a + CNS5 RORE. The concentration of RORγt was constant in all conditions labeled with a (+). (n = 5). (D) Cotransfection assay in EL4 cells demonstrating REV-ERBα competes with endogenous RORγt binding at the Il17a + CNS5 RORE. P+I indicates 18-hr stimulation with phorbol 12-myristate 13-acetate (PMA) and ionomycin (n = 4). (E) FACS analysis of IL-17A and IFNγ expression in TH17 cells transduced with MIGR1, FLREV-ERBα, REV-ERBα DBD, or REV-ERBαΔDBD. Cells were gated on live, GFP+ cells (n = 4). (F) ChIP-qPCR of REV-ERBα binding at various sites in KO and WT TH17 cells collected on day 3. (Il17a-p, Il17a promoter). Data represent mean ± SEM (n = 4). *p < 0.05, **p < 0.01, ***p < 0.001 determined using Student’s t test. ns, not significant (p > 0.05).
Figure 5.
Figure 5.. REV-ERBα-Specific Small Molecules Suppress TH17 Cell Development and Function
(A) Cotransfection assay in HEK293 cells using FL REV-ERBα, REV-ERBβ, and the Il17a + CNS5 luciferase reporter. Graphs demonstrate that SR9009 and SR12418 dose-dependently drive REV-ERB-mediated repression of Il17a + CNS5 luciferase activity. Data represent mean ± SEM (n = 4). (B) Mouse CD4+ T cells were differentiated under TH17 polarizing conditions and treated with vehicle (DMSO), SR9009, or SR12418. IL-17Aand IFNγ expression were analyzed by flow cytometry. Graphs indicate percent IL-17A+ cells and frequency of live cells in cultures with compound treatment (n = 3). (C) FACS analysis and graphs depicting MFI of RORγt expression in TH17 cultures treated with SR9009 and SR12418. (D) Quantitative real-time PCR of TH17-mediated cytokines in cells treated with vehicle (DMSO), SR9009 (5 mm), or SR12418(5 mm). Analysis was performed at 96 hr after T cell activation and compared to naive CD4+ T cells. β-actin was used as the internal control. Data represent mean ± SEM (n = 3). (E) FACS analysis of IL-17A and IFNγ expression inTH7 cellstransduced with MIGR1 RORγt and treated with vehicle (DMSO), SR9009, or SR12418 for 48 hr at the indicated doses. Cells were gated on live, GFP+ cells (n = 4). (F) FACS analysis of thymocytes from mice treated with vehicle, SR2211, SR9009, or SR12418 for 72 hr. Graphs depict quantification of total thymocyte number, double positive percentage, and double positive number in each group (n = 5/group). Data represent mean ± SEM. *p < 0.05, **p < 0.01, ***p < 0.001, ****p < 0.0001 determined using Student’s t test. ns, not significant (p > 0.05).
Figure 6.
Figure 6.. SR12418 Potently Suppresses the Development and Severity of EAE
(A) Clinical EAE scores (left) from mice subjected to MOG-induced EAE and treated with vehicle (10/10/80 formulation of DMSO/Tween80/H2O) or SR12418 (i.p., 50mg/kg, b.i.d.) for the duration of the experiment. Middle and right graphs demonstrate the percent incidence of disease and percent change in body weight overtime between groups, respectively (n = 8–10/group). (B) Frequencies and cell counts of CD3+CD4+ cells in the draining LNs and CNS of mice at peak of disease. V, vehicle; SR, SR12418-treated mice (n = 8, V; n = 7, SR). (C) Graphs depicting the frequencies and cell counts of CD4+GMCSF+ cells in LN and CNS of mice at peak of disease. (D) FACS analysis, frequencies, and cell counts of RORγt+ cells in LNs and CNS of mice at peak of disease. (E) FACS analysis, frequencies, and cell counts of IL-17A+IFNγ, IL-17A+IFNγ+, and IL-17AIFNγ+ cells in the LN and CNS of mice at peak of disease. Cells were gated on live, CD45+CD3+CD4+ cells. Data are mean ± SEM and representative of three separate, independent experiments with similar results. Two-way ANOVA (clinical score) and Student’s t tests were performed for statistical analysis. *p < 0.05, **p < 0.01, ***p < 0.001, ****p < 0.0001.
Figure 7.
Figure 7.. SR12418 Is Effective When Used in Intervention Studies of Colitis and Relapsing-Remitting EAE
(A) Schematic of the adoptive T cell transfer colitis model treatment design. (B-E) FACS plots and graphs demonstrating frequencies of (B) α4β7+, (C) RORγt+, (D) IL-17A+IFNγ, IL-17A+IFNγ+, and IL-17AIFNγ+, and (E) CD25+Foxp3+ T cells in the colons of recipient mice. Cells were gated on live, CD45+CD3+CD4+ cells. V, vehicle; SR, SR12418. Data are mean ± SEM (n = 10/group; PBS, n = 2). (F) Clinical EAE scores from mice subjected to PLP-induced EAE and treated with vehicle or SR12418 (i.p., 50 mg/kg, b.i.d.) starting on day 18 and continued for the duration of the experiment (n = 17/group). (G-K) Graphs demonstrating decreased frequencies and cell numbers of (G) effector CD4 and CD8 T cells and (H) CCR6+ T cells in the CNS of mice treated with SR12418. FACS plots and graphs demonstrating frequencies and/or cell numbers of (I) RORγt+, (J) RORγt+ GM-CSF+, and (K) IL-17A+IFNγ, IL-17A+IFNγ+, and IL-17AIFNγ+ T cells in the CNS of SR12418-treated mice relative to vehicle controls. Cells were gated on live, CD45+CD3+CD4+CD44+cells (n = 7, vehicle; n = 6, SR12418). Data represent mean ± SEM. Two-way ANOVA (clinical score) and Student’s t tests were performed for statistical analysis. *p < 0.05, **p < 0.01, ***p < 0.001.

References

    1. Anders S, and Huber W (2010). Differential expression analysis for sequence count data. Genome Biol 11, R106. - PMC - PubMed
    1. Banerjee S, Wang Y, Solt LA, Griffett K, Kazantzis M, Amador A, El-Gendy BM, Huitron-Resendiz S, Roberts AJ, Shin Y, et al. (2014). Pharmacological targeting of the mammalian clock regulates sleep architecture and emotional behaviour. Nat. Commun 5, 5759. - PMC - PubMed
    1. Bronner SM, Zbieg JR, and Crawford JJ (2017). RORg antagonists and inverse agonists: a patent review. Expert Opin. Ther. Pat 27, 101–112. - PubMed
    1. Chang MR, Lyda B, Kamenecka TM, and Griffin PR (2014). Pharmacologic repression of retinoic acid receptor-related orphan nuclear receptor g is therapeutic in the collagen-induced arthritis experimental model. Arthritis Rheumatol. 66, 579–588. - PMC - PubMed
    1. Chen R, Belanger S, Frederick MA, Li B, Johnston RJ, Xiao N, Liu YC, Sharma S, Peters B, Rao A, et al. (2014). In vivo RNA interference screens identify regulators of antiviral CD4(+) and CD8(+) T cell differentiation. Immunity 41, 324–338. - PMC - PubMed

Publication types

Substances