. 2019 Feb 1:83:51-64.
doi: 10.1016/j.niox.2018.12.007. Epub 2018 Dec 24.

Regulation of endothelial barrier integrity by redox-dependent nitric oxide signaling: Implication in traumatic and inflammatory brain injuries

Affiliations

Regulation of endothelial barrier integrity by redox-dependent nitric oxide signaling: Implication in traumatic and inflammatory brain injuries

Seungho Choi et al. Nitric Oxide. .

Abstract

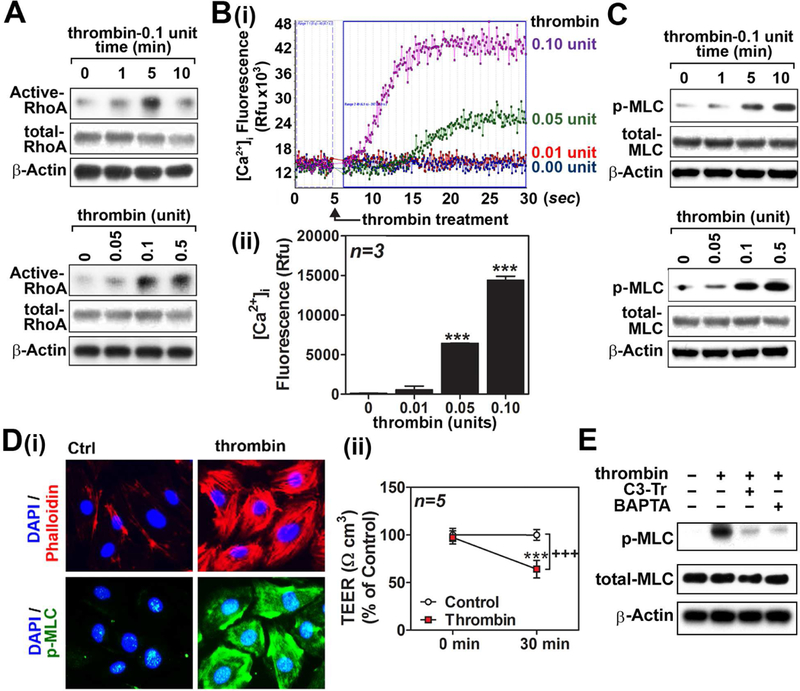
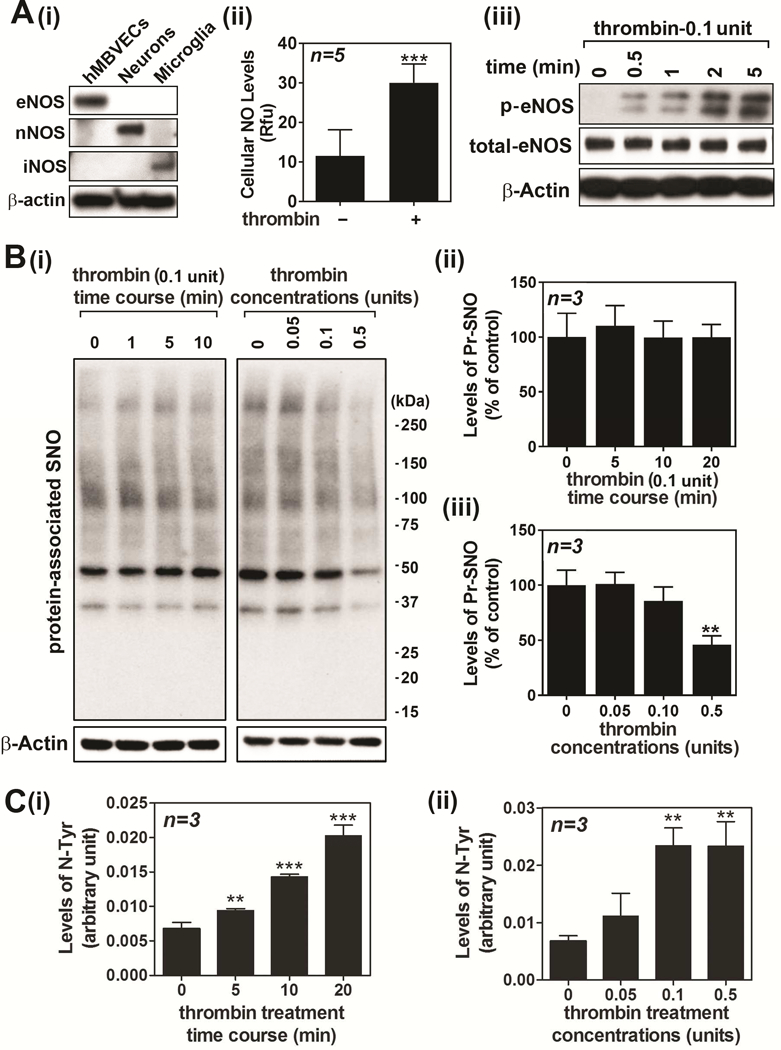
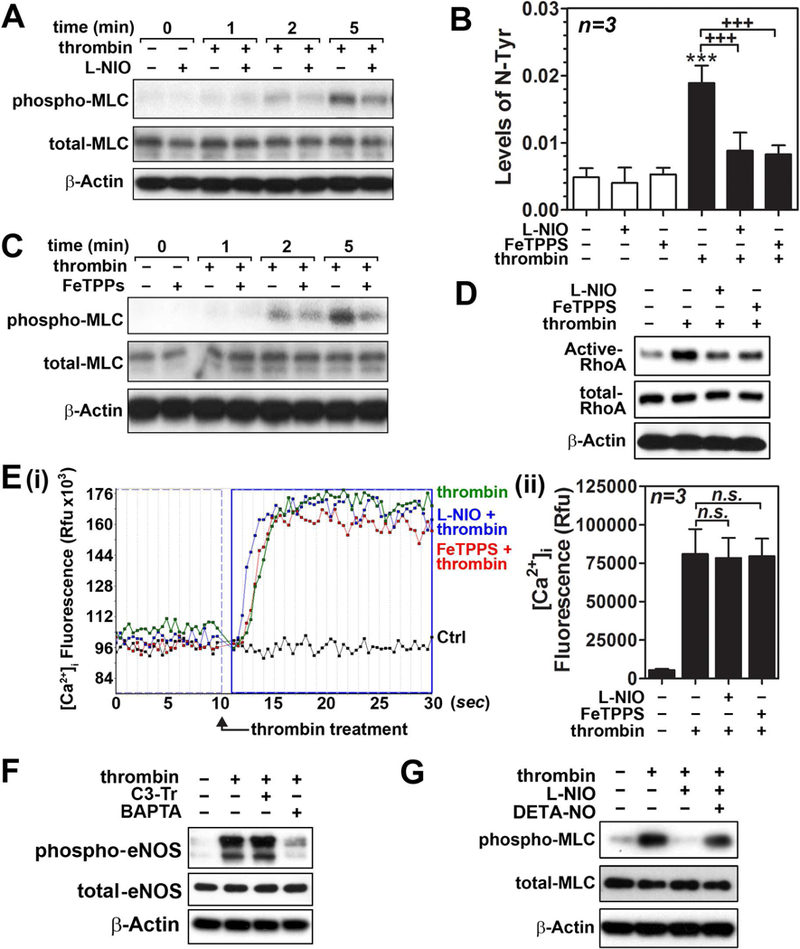
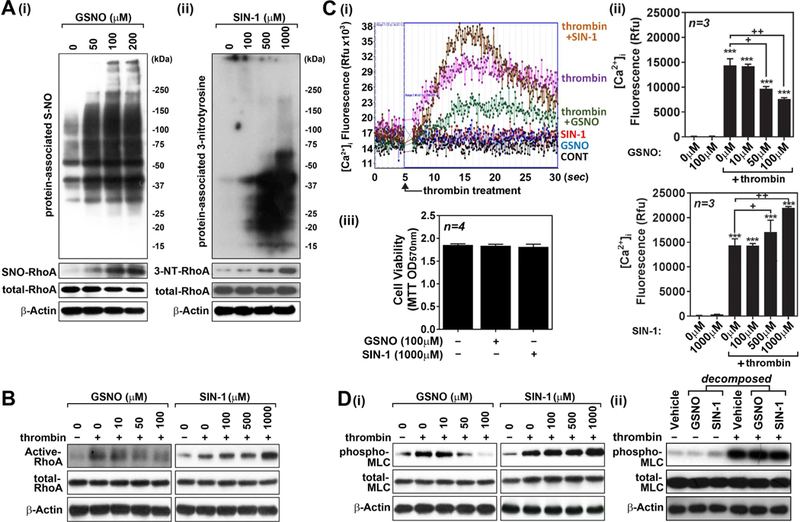
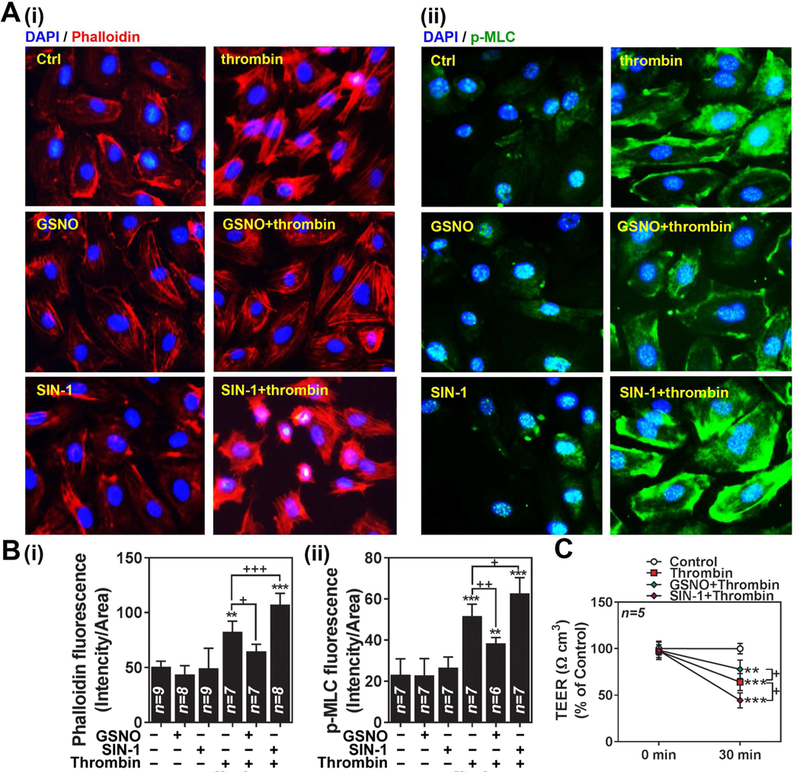
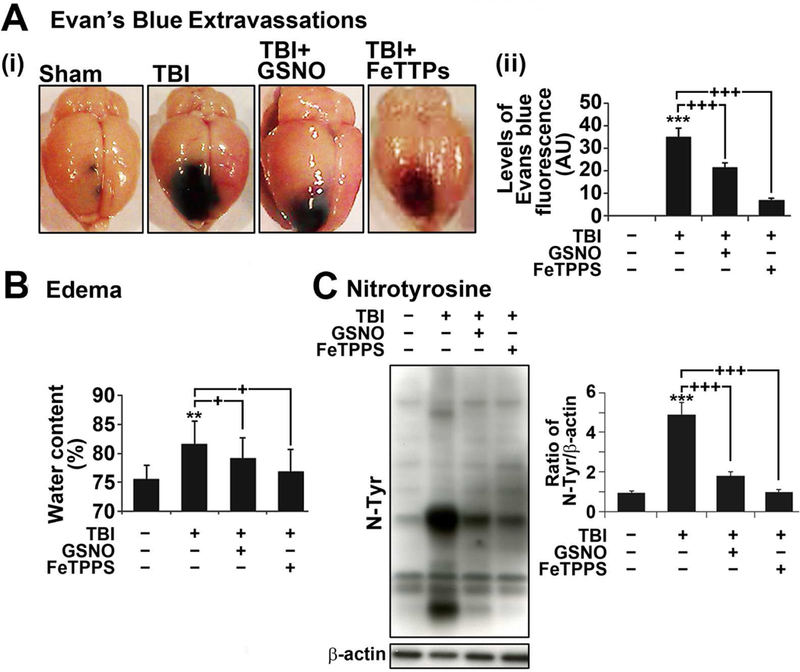
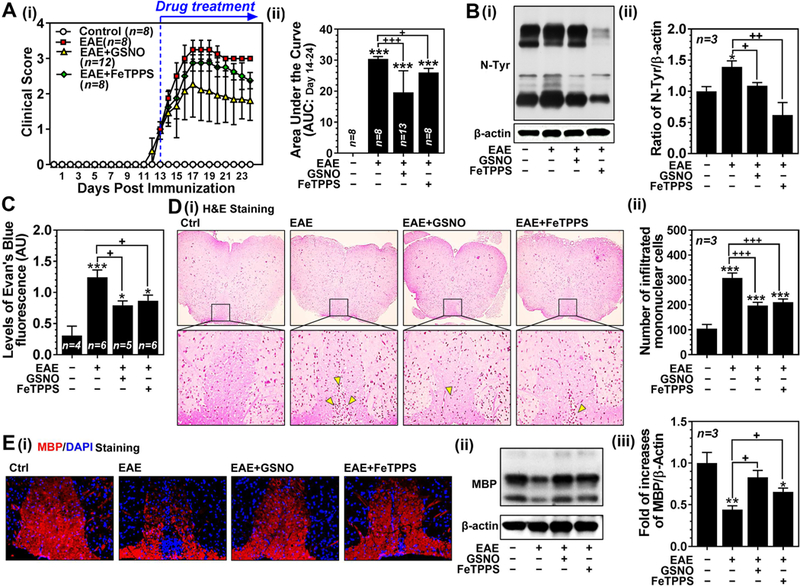
Nitric oxide (NO) synthesized by eNOS plays a key role in regulation of endothelial barrier integrity but underlying cell signaling pathway is not fully understood at present. Here, we report opposing roles of two different redox-dependent NO metabolites; peroxynitrite (ONOO-) vs. S-nitrosoglutathione (GSNO), in cell signaling pathways for endothelial barrier disruption. In cultured human brain microvessel endothelial cells (hBMVECs), thrombin induced F-actin stress fiber formation causes barrier disruption via activating eNOS. Thrombin induced eNOS activity participated in cell signaling (e.g. RhoA and calcium influx mediated phosphorylation of myosin light chain) for F-actin stress fiber formation by increasing ONOO- levels. On the other hand, thrombin had no effect on intracellular levels of S-nitrosoglutathione (GSNO), another cellular NO metabolite. However, exogenous GSNO treatment attenuated the thrombin-induced cell signaling pathways for endothelial barrier disruption, thus suggesting the role of a shift of NO metabolism (GSNO vs. ONOO-) toward ONOO- synthesis in cell signaling for endothelial barrier disruption. Consistent with these in vitro studies, in animal models of traumatic brain injury and experimental autoimmune encephalomyelitis (EAE), ONOO- scavenger treatment as well as GSNO treatment were effective for attenuation of BBB leakage, edema formation, and CNS infiltration of mononuclear cells. Taken together, these data document that eNOS-mediated NO production and following redox-dependent NO metabolites (ONOO- vs. GSNO) are potential therapeutic target for CNS microvascular disease (traumatic and inflammatory) pathologies.

Keywords: Actin stress fiber; Brain endothelial barrier; Endothelial nitric oxide synthase (eNOS); Nitric oxide; Peroxynitrite (ONOOˉ); S-nitrosoglutathione (GSNO).


Conflict of interest statement

Conflict of interest

The author(s) declared no potential conflicts of interest with respect to the research, authorship, and/or publication of this article.

Figures

Figure 1.
Figure 1.. Thrombin induces cell signaling for endothelial barrier disruption in cultured hBMVECs.
Human brain microvessel endothelial cells (hBMVECs) were treated with thrombin (0.1unit/ml) and time dependent activation of RhoA activity was analyzed (left panel). The cells were also treated with various concentrations of thrombin and a dose dependent activation of RhoA activation was analyzed at 5 min following the treatment as described in method section (A). hBMVECs were treated with various concentrations of thrombin and intracellular Ca2+ ([Ca2+]i) influx was analyzed by fluorometric assay as described in method section (B-i). Twenty five seconds following thrombin treatment, the increased [Ca2+]i influxes were represented by bar graph (B-ii). In another set of experiment, thrombin-induced time- and concentration-dependent phosphorylation of myosin light chain (Ser19) was analyzed in hBMVECs by Western analysis. β-actin was used for internal loading control for Western analysis (C). hBMVECs were treated with thrombin (0.1unit/ml for 30 min) and development of F-actin stress fiber was analyzed by immunofluorescent staining of F-actin bundles by Phalloidin (red) and phosphorylated MLC (p-MLC; green). Nuclei were stained by DAPI (blue) (D-i). For endothelial barrier study, hBMVECs cultured on transwell plates were analyzed for transendothelial electric resistance (TEER) in the absence or presence of thrombin (0.1unit/ml for 30 min) treatment (D-ii). To investigate causal relationships between RhoA activation or [Ca2+]i influx and MLC phosphorylation, hBMVECs were pretreated with RhoA inhibitor I (C3 transferase/C3-Tr; 1µg/ml) or [Ca2+]i chelator BAPTA (100µM) for 30min, followed by thrombin treatment (0.1unit/ml) for 10 min, and then cellular levels of phospho- and total-MLC levels were analyzed by Western analysis (E). The vertical bars (B-ii) and dots (D-ii) are means of individual data set (n=3) and T-bars are standard deviation. *** p ≤ 0.001 as compared to control group. All experiments were repeated at least three times and representative data are shown.
Figure 2.
Figure 2.. Effect of thrombin on endothelial eNOS activity and NO metabolism in hBMVECs.
Cell lysates from cultured human brain microvessel endothelial cells (hBMVECs), neurons, and activated microglia were analyzed for expression levels of eNOS, nNOS, and iNOS (A-i). hBMVECs were treated with thrombin (0.1 unit/ml) and the cellular levels of NO was analyzed by fluorometric analysis using dye DAF-FM (A-ii). hBMVECs were treated with thrombin (0.1 unit/ml) and time course activation of eNOS was analyzed by Western analysis using antibody specific to phospho (Ser1177) eNOS (A-iii). β-actin was used for internal loading control and lysate extracted from glutamate treated cultured neurons was used for positive control for nNOS activation. hBMVEC were treated with thrombin and time and concentration dependent accumulation of protein-associated S-nitrosothiols (Pr-SNO) (B) or protein-associated 3-nitrotyrosine (N-Tyr) (C) or were analyzed by biotin switch assay or ELISA, respectively. The vertical columns represent means of individual data set and T-bars are standard deviation. ** p ≤ 0.01 and *** p ≤ 0.001 as compared to the control group. All experiments were repeated at least three times and representative data are shown.
Figure 3.
Figure 3.. Effects of eNOS inhibitor and peroxynitrite scavenger on thrombin-induced cell signaling for endothelial barrier disruption in hBMVECs.
Human brain microvessel endothelial cells (hBMVECs) in the presence or absence of NOS inhibitor L-NIO (10µM; pretreated for 30min) were treated with thrombin (0.1 unit/ml for 5min) and MLC phosphorylation (Ser19) was analyzed by Western analysis with β-actin as internal loading control (A). hBMVECs were treated with thrombin (0.1 unit/ml for 20min) in the presence or absence of L-NIO (10µM; pretreated for 30min) or ONOO scavenger FeTTPS (10µM; pretreated for 30min) and cellular levels of protein-associated 3-nitrotyrosine (a protein adduct formed by ONOO) was analyzed by ELISA (B). hBMVECs were treated with thrombin (0.1 unit/ml for 5min) in the presence or absence of FeTPPS or L-NIO and MLC phosphorylation (C), RhoA activity (D), and intracellular Ca2+ ([Ca2+]i) influx (E) were analyzed. To investigate causal relationship between RhoA activation or [Ca2+]i influx and eNOS phosphorylation (Ser1177), hBMVECs were pretreated with RhoA inhibitor I (C3 transferase/C3-Tr; 1µg/ml) or [Ca2+]i chelator BAPTA [1,2-bis(o-aminophenoxy)ethane-N,N,N′,N′-tetraacetic acid; 100µM] for 30min, followed by thrombin treatment (0.1unit/ml) for 10 min, then cellular levels of phospho and total eNOS levels were analyzed by Western analysis (F). To confirm the role of eNOS in regulation of MLC phosphorylation, hBMVECs were treated with NOS inhibitor L-NIO (10µM), in the presence or absence of DETA-NO (free NO donor; 1mM), for 30min and effect of thrombin (0.1 unit/ml for 5min) on MLC phosphorylation was analyzed by Western analysis. The vertical bars are means of individual data and T-bars are standard deviation. *** p ≤ 0.001 as compared to the control group. +++ p ≤ 0.001 as compared to thrombin treated group. All experiments were repeated at least three times and representative data are shown.
Figure 4.
Figure 4.. Opposing roles of GSNO vs. ONOO in thrombin-induced cell signaling for endothelial barrier disruption in hBMVECs.
Human brain microvessel endothelial cells (hBMVECs) were treated with various concentrations of GSNO or SIN-1 (ONOO donor), incubated for 2hr, and cellular levels of S-nitrosylated proteins and RhoA (A-i) and tyrosine-nitrated proteins and RhoA (A-ii) were analyzed as described in method section. hBMVECs were treated with thrombin (0.1 unit/ml for 5min), in the presence or absence of various concentrations GSNO or SIN-1 (pretreated for 2hr), and RhoA activity was analyzed as described in method section (B). hBMVECs were treated with thrombin (0.1 unit/ml) in the presence or absence of various concentrations GSNO or SIN-1 and intracellular Ca2+ ([Ca2+]i) influx (C-i and ii) and cell viability (MTT assay) (C-iii) were analyzed. hBMVECs were treated with thrombin (0.1 unit/ml for 5min), in the presence or absence of various concentrations GSNO or SIN-1 (D-i) or decomposed GSNO (100µM) or SIN-1 (1000µM) (D-ii), and MLC phosphorylation was analyzed by Western analysis. β-actin was used for internal loading control for Western analysis. The vertical bars are means of individual data and T-bars are standard deviation. *** p ≤ 0.001 as compared to the control group. + p ≤ 0.05 and ++ p ≤ 0.01 as compared to thrombin treated group. All experiments were repeated at least three times.
Figure 5.
Figure 5.. Opposing roles of GSNO vs. ONOO in thrombin-induced cell signaling for endothelial barrier disruption in hBMVECs.
A. Human brain microvessel endothelial cells (hBMVECs) were treated with thrombin (0.1 unit/ml for 30min) in the presence or absence of GSNO (100µM; pretreated for 2hr) or SIN-1 (100µM; pretreated for 2hr) and development of F-actin stress fiber was analyzed by immunofluorescent staining of F-actin bundles by Phalloidin (red-i) and phosphorylated MLC (p-MLC; green-ii). Nuclei were stained by DAPI (blue). B. The resulting digital images were used for quantification of fluorescence and the data is represented by RFU (relative fluorescence unit). C. hBMVECs were cultured on transwell plates and transendothelial electric resistance (TEER) was analyzed. The cells were treated with thrombin (0.1 unit/ml for 5min) in the absence or presence of GSNO (100µM; pretreated for 2hr) or SIN-1 (500µM; pretreated for 2hr). The vertical bars and dotted lines are means of individual data and T-bars are standard deviation. ** p ≤ 0.01 and *** p ≤ 0.001 as compared to the control group. + p ≤ 0.05, ++ p ≤ 0.01, and +++ p ≤ 0.001 as compared to thrombin treated group. All experiments were repeated at least three times.
Figure 6.
Figure 6.. Roles of GSNO and FeTPPS on BBB leakage, edema and the expression of 3-NT in TBI rat model.
A. Photographs showing Evan’s blue (EB) extravasations in brain starting at 4 hr after TBI. Animals were sacrificed at 24 hr, the brain was photographed (i) and the intensity of EB (ii) was determined by spectrofluorometric estimation. EB extravasations were not observed in sham brain. B. Edema (tissue water content) was measured at 24 hr after TBI. C. The levels of nitrotyrosine (N-Tyr) as an index of ONOO were also measured at 24 hr in the traumatic penumbra region using Western and its quantitation by densitometry. Data are expressed as mean ± standard deviation from five different experiments for Evan’s blue and edema each and three different experiments for western blot. * p ≤ 0.05, *** p ≤ 0.001 vs. Sham and + p ≤ 0.05, ++ p ≤ 0.01, and +++ p ≤ 0.001 vs. TBI.
Figure 7.
Figure 7.. Roles of GSNO and FeTPPS on clinical disease, expression of 3-nitrotyrosine, BBB leakage, and spinal cord demyelination in mouse EAE model.
A. Clinical score of control C57BL/6 mice (Ctrl: n=8), C57BL/6 mice immunized with MOG35–55 peptide (EAE: n=8), EAE mice treated with 1mg/kg/day of GSNO (EAE+GSNO: n=12) or 30 mg/kg/day of FeTPPS (EAE+FeTPPS: n=8) was determined daily as described in Materials and Methods (A-i). All drugs were administered starting at the day of disease onset (day 13 post-immunization) via intraperitoneal routes. The area under the curve (AUC) between post immunization day 14 and 24 of the overall disease severity was calculated and represented as bar graph (A-ii). B. At 24 day post-immunization, the mice (n=3) were sacrificed and the levels of 3-nitrotyrosine (N-Tyr), as an index of ONOO, were measured by Western (B-i) and densitometry analysis (B-ii). C. In addition, another set of mice were injected with Evans blue for analysis of BBB leakage. D. Spinal cord infiltration of mononuclear cells was analyzed by H&E staining of paraffin-embedded spinal cord section (D-i). The number of mononuclear cells (dark-brown nuclei aggregates indicated by yellow triangles) was counted manually and represented by bar graph (D-ii). E. The spinal cord sections and tissue lysates were also subjected to immunofluorescent staining (E-i) and Western analysis for MBP (E-ii and -iii) for degree of demyelination. Data are expressed as mean ± standard deviation. *p ≤ 0.05, ** p ≤ 0.01, *** p ≤ 0.001 vs. control and + p ≤ 0.05, ++ p ≤ 0.01, and +++ p ≤ 0.001 vs. EAE.

Similar articles

Cited by

References

    1. Neuwelt EA, Bauer B, Fahlke C, Fricker G, Iadecola C, Janigro D, Leybaert L, Molnar Z, O’Donnell ME, Povlishock JT, Saunders NR, Sharp F, Stanimirovic D, Watts RJ, Drewes LR, Engaging neuroscience to advance translational research in brain barrier biology, Nat Rev Neurosci 12 (2011) 169–82. - PMC - PubMed
    1. Obermeier B, Daneman R, Ransohoff RM, Development, maintenance and disruption of the blood-brain barrier, Nat Med 19 (2013) 1584–96. - PMC - PubMed
    1. Neumann-Haefelin T, Kastrup A, de Crespigny A, Yenari MA, Ringer T, Sun GH, Moseley ME, Serial MRI after transient focal cerebral ischemia in rats: dynamics of tissue injury, blood-brain barrier damage, and edema formation, Stroke 31 (2000) 1965–72; discussion 1972–3. - PubMed
    1. Olah L, Wecker S, Hoehn M, Secondary deterioration of apparent diffusion coefficient after 1-hour transient focal cerebral ischemia in rats, J Cereb Blood Flow Metab 20 (2000) 1474–82. - PubMed
    1. Kaur J, Tuor UI, Zhao Z, Petersen J, Jin AY, Barber PA, Quantified T1 as an adjunct to apparent diffusion coefficient for early infarct detection: a high-field magnetic resonance study in a rat stroke model, Int J Stroke 4 (2009) 159–68. - PubMed

Publication types