. 2019 Mar 1;29(3):1369-1381.
doi: 10.1093/cercor/bhy330.

Waves of Maturation and Senescence in Micro-structural MRI Markers of Human Cortical Myelination over the Lifespan

Affiliations

Waves of Maturation and Senescence in Micro-structural MRI Markers of Human Cortical Myelination over the Lifespan

Håkon Grydeland et al. Cereb Cortex. .

Abstract

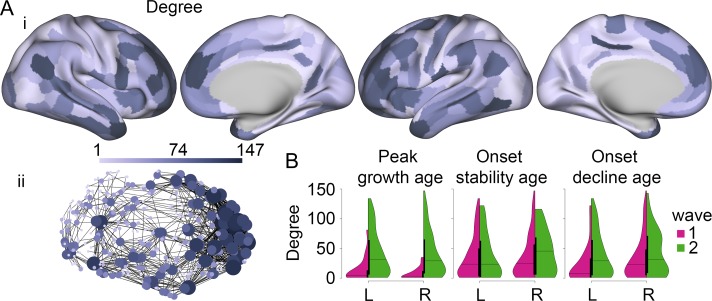
Seminal human brain histology work has demonstrated developmental waves of myelination. Here, using a micro-structural magnetic resonance imaging (MRI) marker linked to myelin, we studied fine-grained age differences to deduce waves of growth, stability, and decline of cortical myelination over the life-cycle. In 484 participants, aged 8-85 years, we fitted smooth growth curves to T1- to T2-weighted ratio in each of 360 regions from one of seven cytoarchitectonic classes. From the first derivatives of these generally inverted-U trajectories, we defined three milestones: the age at peak growth; the age at onset of a stable plateau; and the age at the onset of decline. Age at peak growth had a bimodal distribution comprising an early (pre-pubertal) wave of primary sensory and motor cortices and a later (post-pubertal) wave of association, insular and limbic cortices. Most regions reached stability in the 30-s but there was a second wave reaching stability in the 50-s. Age at onset of decline was also bimodal: in some right hemisphere regions, the curve declined from the 60-s, but in other left hemisphere regions, there was no significant decline from the stable plateau. These results are consistent with regionally heterogeneous waves of intracortical myelinogenesis and age-related demyelination.


Figures

Figure 1.
Figure 1.
Milestones of human intracortical myelinogenesis estimated from non-linear growth curves of T1w/T2w MRI data measured across the life-cycle. A. Surface maps of T1w/T2w values averaged across the nearly 80 years of the lifespan (N = 484). B. Average T1w/T2w values across the 360 regions for each participant plotted against the participants’ age. The fitted cubic spline and the 99% CI are plotted in magenta. C. The fitted cubic spline and the 99% CI (magenta) from B, and the estimated rate of change (first derivative) and the 99% CI (green). D. The three milestones: M1 = peak growth age (19 years), M2 = onset stability age (37 years), M3 = onset decline age (69 years).
Figure 2.
Figure 2.
Intracortical T1w/T2w MRI milestone maps, and bimodal distributions suggesting that timing of generation and degeneration of myelination occurs in waves. A. Surface maps of peak growth age, onset stability age, and onset decline age. B. Histograms for (i) peak growth age, (ii) onset stability age, and (iii) onset decline age with the fit of a two-component Gaussian mixture model overlaid (in magenta and green). Age used for dichotomization into early and late waves (gray vertical bar) for peak growth age was 12.7 years, stability 39.5 years, and decline 77 years. Black dotted line = probability density. C. Surface maps of early (magenta) and late (dark green) waves based on B. D. Word clouds based on correlations with NeuroSynth meta-analysis maps for the early and late waves at each milestone.
Figure 3.
Figure 3.
Milestones of intracortical MRI growth curves were related to cross-sectional rates of change in generation and degeneration of myelination. A. Surface maps depicting rates of (i) peak growth (i.e., the derivative at M1), and (ii) decline (i.e., the derivative at mid-point between M3 and the end of the age range). B. Inter-regional association between micro-structural maturation, and decline rate. Regression line in black (R2 = 0.43, P < 0.001), the 95% CI in shaded gray. C. Violin plots of the relationship between rate of peak growth (top row), and decline (bottom row) with age of peak maturation (first column), stability, decline, respectively, showing significant differences between early (magenta) and later (green) waves at each milestone.
Figure 4.
Figure 4.
Hubs of the structural covariance connectome have a long period of adolescent and early adult myelination, with delayed onset of maturity, but later onset of decline. A. The structural covariance network. High-degree centrality hubs were concentrated anatomically in association cortical areas. i. Surface maps of degree. ii. Network representation, nodes are colored and sized by degree (only the top 2% strongest connections are shown for clarity). B. Violin plots, split per hemisphere and early (magenta) and late (green) waves, for peak growth age, onset stability age, and onset decline age. L/R = left/right hemisphere.
Figure 5.
Figure 5.
Hubs of the functional connectome have a short period of adolescent and early adult myelination, with early onset of maturity, and early onset of decline. A. The functional network. High-degree centrality hubs were mainly concentrated in primary visual and motor cortices. i. Surface maps of degree. ii. Network representation, nodes are colored and sized by degree (only the top 2% strongest connections are shown for clarity). B. Violin plots, split per hemisphere and early (magenta) and late (green) waves, for peak growth age, onset stability age, and onset decline age. L/R = left/right hemisphere.

References

    1. Achard S, Delon-Martin C, Vertes PE, Renard F, Schenck M, Schneider F, Heinrich C, Kremer S, Bullmore ET. 2012. Hubs of brain functional networks are radically reorganized in comatose patients. Proc Natl Acad Sci USA. 109:20608–20613. - PMC - PubMed
    1. Alexander-Bloch A, Clasen L, Stockman M, Ronan L, Lalonde F, Giedd J, Raznahan A. 2016. Subtle in-scanner motion biases automated measurement of brain anatomy from in vivo MRI. Hum Brain Mapp. 37:2385–2397. - PMC - PubMed
    1. Alexander-Bloch A, Giedd JN, Bullmore E. 2013. Imaging structural co-variance between human brain regions. Nat Rev Neurosci. 14:322–336. - PMC - PubMed
    1. Alexander-Bloch AF, Gogtay N, Meunier D, Birn R, Clasen L, Lalonde F, Lenroot R, Giedd J, Bullmore ET. 2010. Disrupted modularity and local connectivity of brain functional networks in childhood-onset schizophrenia. Front Syst Neurosci. 4:147. - PMC - PubMed
    1. Arshad M, Stanley JA, Raz N. 2016. Adult age differences in subcortical myelin content are consistent with protracted myelination and unrelated to diffusion tensor imaging indices. Neuroimage. 143:26–39. - PMC - PubMed

Publication types