

Socioeconomic position during pregnancy and DNA methylation signatures at three stages across early life: epigenome-wide association studies in the ALSPAC birth cohort
- PMID: 30590607
- PMCID: PMC6443021
- DOI: 10.1093/ije/dyy259
Socioeconomic position during pregnancy and DNA methylation signatures at three stages across early life: epigenome-wide association studies in the ALSPAC birth cohort
Abstract
Background: Socioeconomic experiences are recognized determinants of health, and recent work has shown that social disadvantages in early life may induce sustained biological changes at molecular level that are detectable later in life. However, the dynamics and persistence of biological embedding of socioeconomic position (SEP) remains vastly unexplored.
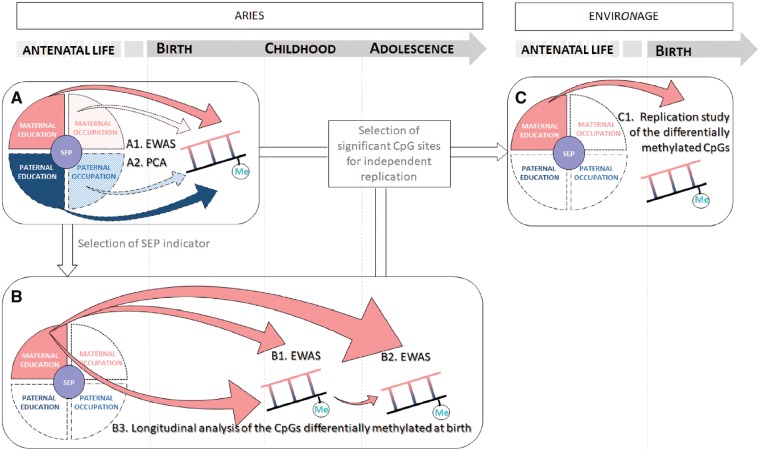
Methods: Using the data from the ALSPAC birth cohort, we performed epigenome-wide association studies of DNA methylation changes at three life stages (birth, n = 914; childhood at mean age 7.5 years, n = 973; and adolescence at mean age 15.5 years, n = 974), measured using the Illumina HumanMethylation450 Beadchip, in relation to pregnancy SEP indicators (maternal and paternal education and occupation).
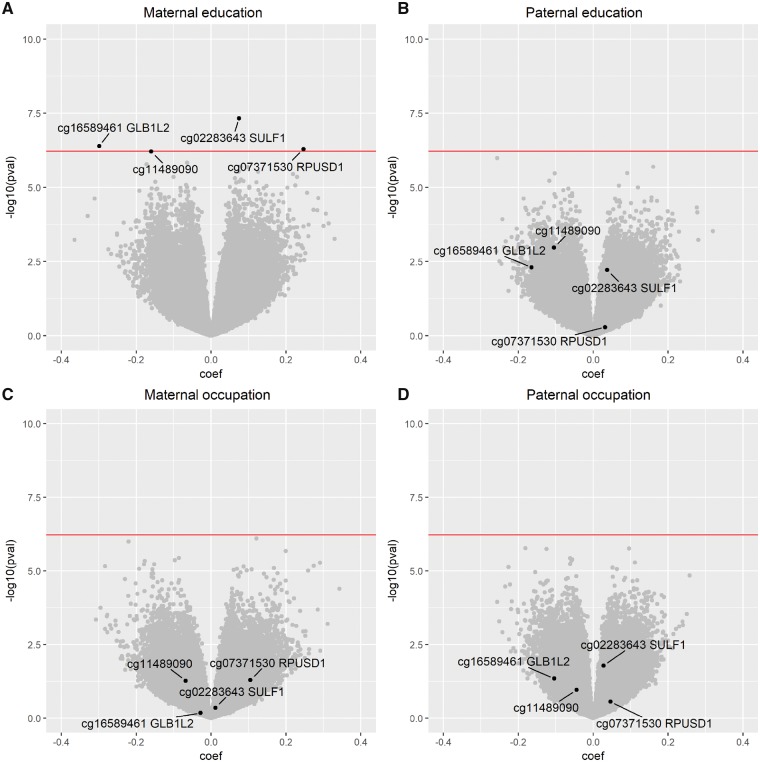
Results: Across the four early life SEP metrics investigated, only maternal education was associated with methylation levels at birth, and four CpGs mapped to SULF1, GLB1L2 and RPUSD1 genes were identified [false discovery rate (FDR)-corrected P-value <0.05]. No epigenetic signature was found associated with maternal education in child samples, but methylation levels at 20 CpG loci were found significantly associated with maternal education in adolescence. Although no overlap was found between the differentially methylated CpG sites at different ages, we identified two CpG sites at birth and during adolescence which are 219 bp apart in the SULF1 gene that encodes an heparan sulphatase involved in modulation of signalling pathways. Using data from an independent birth cohort, the ENVIRONAGE cohort, we were not able to replicate these findings.
Conclusions: Taken together, our results suggest that parental SEP, and particularly maternal education, may influence the offspring's methylome at birth and adolescence.
Keywords: DNA methylation; Social class; education; occupations.
© The Author(s) 2018; all rights reserved. Published by Oxford University Press on behalf of the International Epidemiological Association.
Figures
References
-
- Barker DJ. The developmental origins of adult disease. J Am Coll Nutr 2004;23(Suppl 6):588s–95s. - PubMed
-
- Hertzman C. The biological embedding of early experience and its effects on health in adulthood. Ann N Y Acad Sci 1999;896:85–95. - PubMed
-
- Galobardes B, Lynch JW, Davey Smith G.. Childhood socioeconomic circumstances and cause-specific mortality in adulthood: systematic review and interpretation. Epidemiol Rev 2004;26:7–21. - PubMed
-
- Galobardes B, Davey Smith G, Lynch JW.. Systematic review of the influence of childhood socioeconomic circumstances on risk for cardiovascular disease in adulthood. Ann Epidemiol 2006;16:91–104. - PubMed
-
- Pillas D, Marmot M, Naicker K, Goldblatt P, Morrison J, Pikhart H.. Social inequalities in early childhood health and development: a European-wide systematic review. Pediatr Res 2014;76:418–24. - PubMed
Publication types
MeSH terms
Substances
Grants and funding
- BB/I025751/1/BB_/Biotechnology and Biological Sciences Research Council/United Kingdom
- MR/L01341X/1/MRC_/Medical Research Council/United Kingdom
- MC_PC_15018/MRC_/Medical Research Council/United Kingdom
- MC_UU_00011/5/MRC_/Medical Research Council/United Kingdom
- BB/I025263/1/BB_/Biotechnology and Biological Sciences Research Council/United Kingdom
