. 2019 Feb 28;47(4):1935-1949.
doi: 10.1093/nar/gky1280.

Resolution of the Holliday junction recombination intermediate by human GEN1 at the single-molecule level

Affiliations

Resolution of the Holliday junction recombination intermediate by human GEN1 at the single-molecule level

Mohamed A Sobhy et al. Nucleic Acids Res. .

Abstract

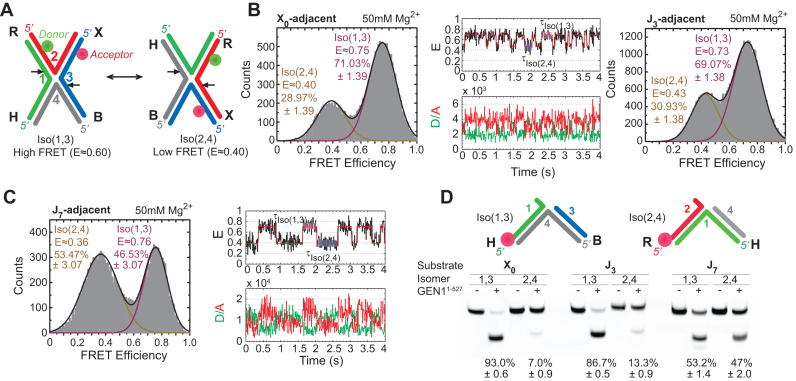
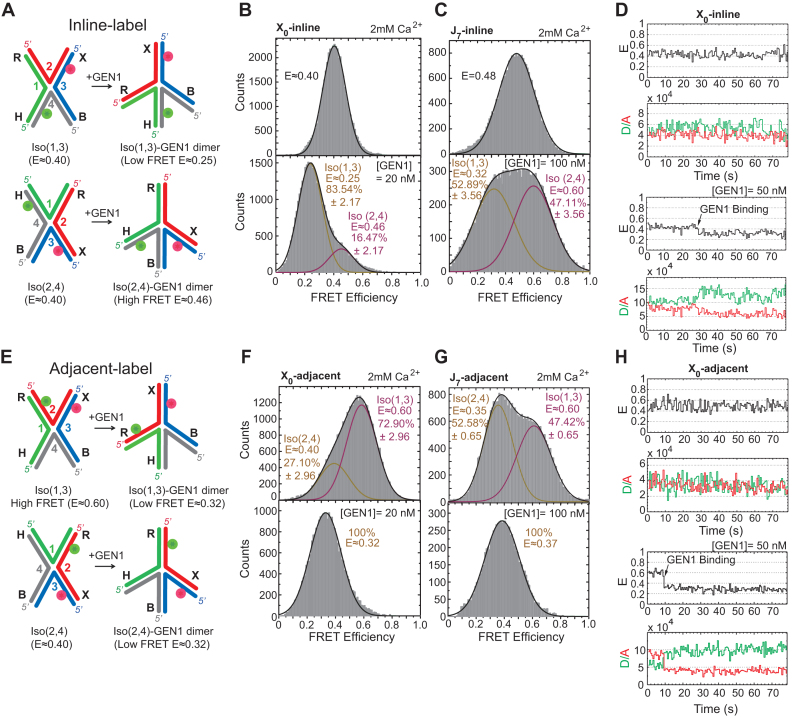
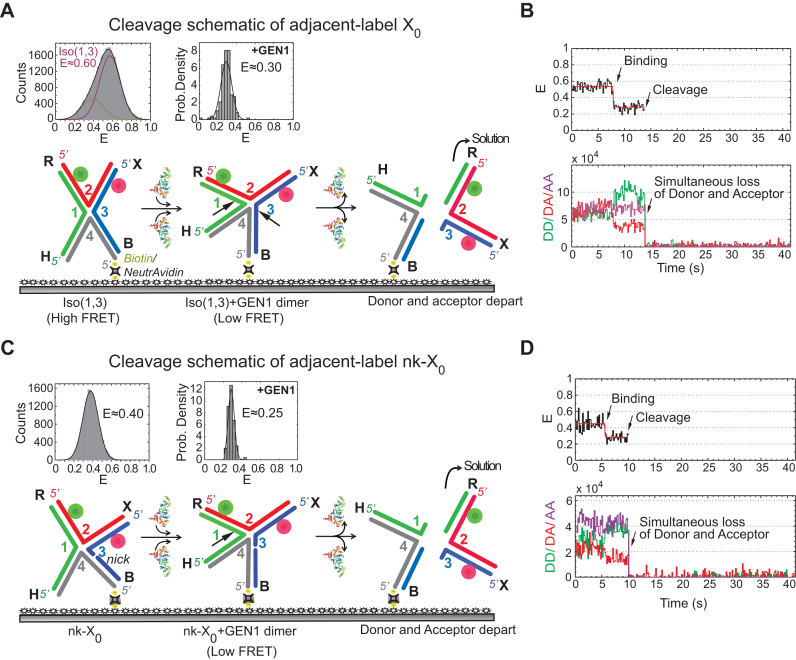
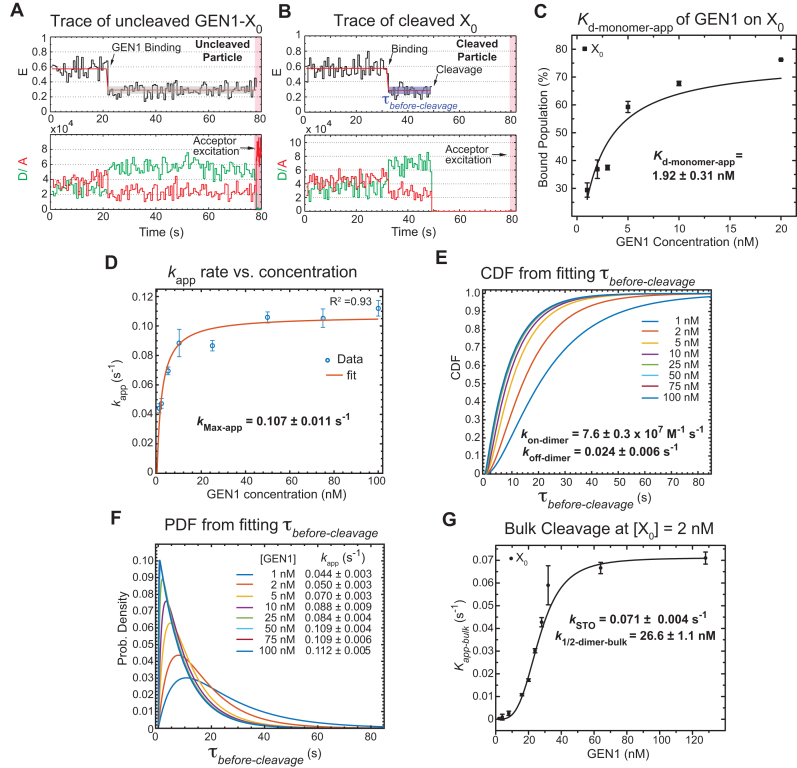
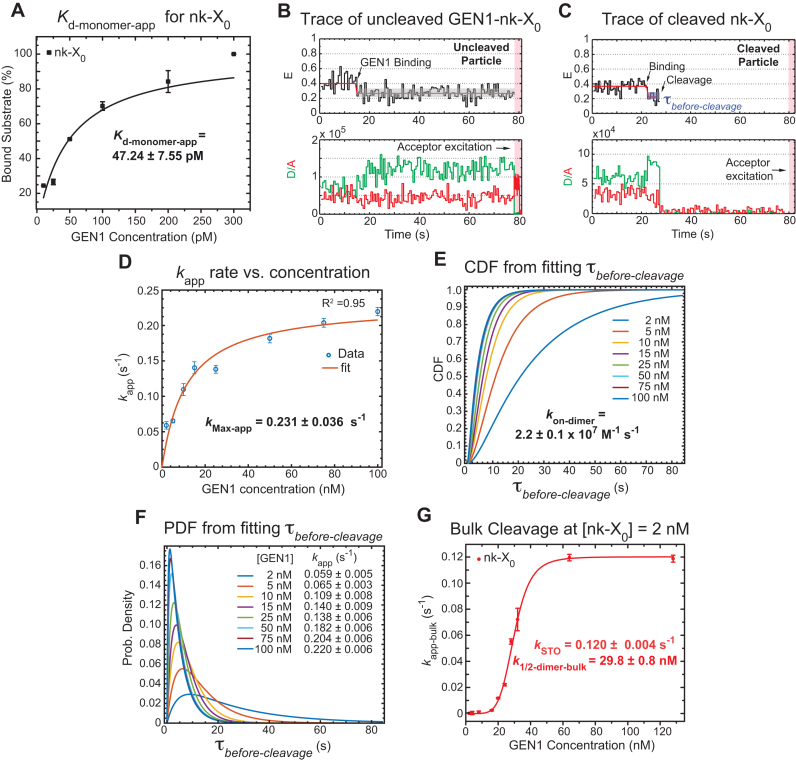
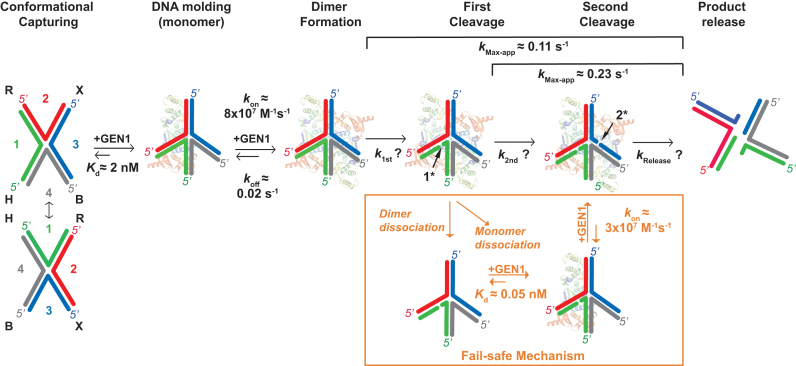
Human GEN1 is a cytosolic homologous recombination protein that resolves persisting four-way Holliday junctions (HJ) after the dissolution of the nuclear membrane. GEN1 dimerization has been suggested to play key role in the resolution of the HJ, but the kinetic details of its reaction remained elusive. Here, single-molecule FRET shows how human GEN1 binds the HJ and always ensures its resolution within the lifetime of the GEN1-HJ complex. GEN1 monomer generally follows the isomer bias of the HJ in its initial binding and subsequently distorts it for catalysis. GEN1 monomer remains tightly bound with no apparent dissociation until GEN1 dimer is formed and the HJ is fully resolved. Fast on- and slow off-rates of GEN1 dimer and its increased affinity to the singly-cleaved HJ enforce the forward reaction. Furthermore, GEN1 monomer binds singly-cleaved HJ tighter than intact HJ providing a fail-safe mechanism if GEN1 dimer or one of its monomers dissociates after the first cleavage. The tight binding of GEN1 monomer to intact- and singly-cleaved HJ empowers it as the last resort to process HJs that escape the primary mechanisms.


Figures

Figure 1.
Figure 1.
Conformation capturing of the HJ by GEN1. (A) Schematic of isomerizing adjacent-label X-stacked HJ conformers. The strands are numbered while the arms are denoted by letters. The conformers are named after the two continuous strands and their incision sites are shown by arrows. The location of the donor (green) and acceptor (red) and change in FRET upon isomerization are indicated. (B) Left panel: FRET histogram of X0 at 50 mM Mg2+. Middle panel: FRET time trace (black) and idealized FRET trace (red) of X0 at 50 mM Mg2+. The fluorescence intensities of the donor (green) and the acceptor (red) are shown below. Right panel: FRET histogram of J3 at 50 mM Mg2+. (C) FRET histogram and time traces of J7 at 50 mM Mg2+. (D) Bulk cleavage of X0, J3 and J7 junctions. The uncertainties in panels B and C represent the standard deviations from two or more experiments. The error bars in the bulk cleavage assay (panel D) represent the standard error of the mean (SEM) from two experiments.
Figure 2.
Figure 2.
Active distortion of the HJ by GEN1 (A) Inline-label schematic of the HJ structural distortion by GEN1 based on the proposed model (36). (B) FRET histogram of inline-label X0 showing a single peak (E ≈ 0.40). At saturating GEN1 concentration, the major low FRET peak (E ≈ 0.25) is attributed to GEN1-Iso(1,3) while the minor high FRET peak (E ≈ 0.46) results from GEN1-Iso(2,4). (C) FRET histogram of J7 showing a single peak (E ≈ 0.48). GEN1 binding to Iso(1,3) and Iso(2,4) yields two nearly equal populations of low and high FRET isomers, respectively. (D) Upper panel: FRET time trace of inline-label X0. Lower panel: GEN1 is flown in Ca2+ buffer to detect the onset of binding. A stable complex persists throughout the acquisition time. (E) GEN1 binding to adjacent-label Iso(1,3) and Iso(2,4) forms a low FRET structure (E ≈ 0.32). (F) FRET histogram of X0 exhibits a major high FRET peak (E ≈ 0.60) corresponding to Iso(1,3) and a lower FRET peak (E ≈ 0.40) for Iso(2,4). At saturating GEN1 concentration, the whole histogram is transformed into a single low FRET peak. (G) FRET histogram of J7 exhibits two nearly equal populations at high and low FRET corresponding to Iso(1,3) and Iso(2,4), respectively. Binding of GEN1 forms a low FRET structure corresponding to a single peak (E ≈ 0.37). (H) Upper panel: FRET time trace of adjacent-label X0. Lower panel: GEN1 binding forms a stable low FRET state (E ≈ 0.32). The uncertainties in panels B, C, F, G represent the standard deviations from two or more experiments.
Figure 3.
Figure 3.
Real-time resolution of the HJ resolution by GEN1 (A) Schematic of the adjacent-label X0 Iso(1,3) attached to the functionalized glass surface by the 5′ end of strand 4 via biotin/NeutrAvidin linkage. The FRET histogram of X0 at 2 mM Mg2+ is shown above the schematic. The probability density histogram of the FRET state from which cleavage occurs has the same FRET (E ≈ 0.30) as that observed in the binding experiment (Figure 2F). The dissociation of GEN1 after the two incisions results in two DNA duplex products: one harboring both the donor and acceptor that goes into solution and another unlabeled duplex that remains attached to the surface. (B) FRet alEX time trace (black) at 2 mM Mg2+ of the cleavage of Iso(1,3). The onset of GEN1 binding forms a stable low FRET state until the FRET signal is abruptly lost due to cleavage. Correspondingly, the increase in the donor and the decrease of acceptor fluorescence intensities upon GEN1 binding is followed by the simultaneous disappearance of the fluorescence from both dyes upon cleavage. The direct excitation of the acceptor (purple) confirms its loss. (C) Schematic of the adjacent-label nicked junction (nk-X0). The FRET histogram exhibits a single peak for a relaxed non-isomerizing structure. The binding of GEN1 prior to cleavage distorts the junction, as shown by the probability density histogram centered at E ≈ 0.25. The resolution occurs by cleaving strand 1 as indicated by the arrow, thus releasing the DNA duplex holding both fluorophores into solution. (D) FRet alEX time trace shows a stable low FRET state upon GEN1 binding which is concluded by the abrupt loss of the FRET signal. The donor and the acceptor signals from both FRET and direct excitation are lost upon resolution.
Figure 4.
Figure 4.
GEN1 monomer binds tightly to the HJ followed by dimer formation (A) FRET time trace of bound but uncleaved adjacent-label X0 in Mg2+. Donor excitation for ≈ 1.3 min was performed, followed by direct acceptor excitation for 4 s (shaded red region). (B) FRET time trace of bound and cleaved X0. Subsequent acceptor excitation (shaded red region) shows the absence of the acceptor. Dwell times of the low FRET state (formula image) at the respective GEN1 concentration were obtained from two or more experiments and used to obtain average rates (kapp). (C) The binding isotherm is constructed by titrating GEN1 under Ca2+ and determining the percentage of bound HJ from the FRET histograms (Supplementary Figure S3A). The error bars are as described in Figure 1 and 2. The dissociation constant (Kd-monomer-app) is determined from a hyperbolic fit of the plot. (D) kapp versus GEN1 concentration plot is fitted to a hyperbolic function to determine the apparent catalytic rate (kMax-app). (E) The Cumulative Density Function (CDF) plot is obtained by fitting the formula image distribution at the respective GEN1 concentration to a bi-exponential model (Supplementary Material, Figure S3B). The association (kon-dimer) and dissociation (koff-dimer) rates for dimer formation are determined from the deconvolution. (F) The Probability Density Function (PDF) plot of the formula image distribution illustrates its dependence on GEN1 concentration. The listed kapp rates are determined from the inverse of the mean formula image at the respective GEN1 concentration. The errors represent SEM of kapp. (G) The X0 apparent rate (kapp-bulk) versus GEN1 concentration plot from bulk cleavage is fit to a sigmoidal function yielding values of half-maximum activity (k1/2-dimer-bulk) and single turnover (kSTO). Error bars represent the SEM from two experiments. The concentration for half-maximum activity indifferent of substrate inhibition (k1/2-dimer-bulk-tQSSA) was determined by the first-order total quasi-steady-state approximation (tQSSA) (Supplementary Figure S5E).
Figure 5.
Figure 5.
Fail-safe mechanism to ensure the symmetrical cleavage of the HJ (A) The binding isotherm of nk-X0 is constructed from the percentage of bound substrate as a function of GEN1 concentration (Supplementary Figure S6A). The Kd-monomer-app is determined from the hyperbolic fit to the binding isotherm. (B) FRET time trace of uncleaved nk-X0 is acquired by direct donor excitation as described in Figure 4A. These traces were observed from Kd-monomer-app until a few nanomolar GEN1 concentration. (C) Upper panel: FRET time trace of a cleaved nk-X0 junction demonstrates the low FRET state before cleavage followed by the disappearance of the FRET signal. Lower panel: The fluorescence of the donor and the acceptor from FRET and direct excitation are lost after cleavage. (D) The plot of kapp of nk-X0 versus GEN1 concentration is fitted to a hyperbolic function. (E) The CDF plot is derived from fitting the formula image distribution at the respective GEN1 concentration to a bi-exponential model (Supplementary Figure S6B). (F) The PDF plot of the formula image distributions and the respective kapp rates. (G) Plot of kapp-bulk of nk-X0 as a function of GEN1 concentration. k1/2-dimer-bulk was determined from the sigmoidal fit. k1/2-dimer-bulk-tQSSA was determined by tQSSA (Supplementary Figure S5F).
Figure 6.
Figure 6.
Timeline representation of GEN1 interaction with the HJ. The steps involved in the resolution of GEN1 of the HJ include: DNA conformational capturing (one isomer is selected for simplicity), DNA molding by GEN1 monomer, dimer formation, first cleavage, second cleavage and product release. The diagram sketches a fail-safe mechanism in case GEN1 dimer or one of its monomers dissociates after the first cleavage of the complex. The asterisk indicates that the order of cleavage can be interchangeable.

References

    1. Holliday R. Mechanism for gene conversion in fungi. Genet. Res. 1964; 5:282. - PubMed
    1. West S.C. Formation, translocationand resolution of Holliday junctions during homologous genetic recombination. Philos. Trans.R. Soc. Lond., B, Biol. Sci. 1995; 347:21. - PubMed
    1. Cox M.M., Goodman M.F., Kreuzer K.N., Sherratt D.J., Sandler S.J., Marians K.J.. The importance of repairing stalled replication forks. Nature. 2000; 404:37. - PubMed
    1. West S.C. Molecular views of recombination proteins and their control. Nat. Rev. Mol. Cell Biol. 2003; 4:435. - PubMed
    1. Potter H., Dressler D.. On the mechanism of genetic recombination: electron microscopic observation of recombination intermediates. Proc. Natl. Acad. Sci. U.S.A. 1976; 73:3000. - PMC - PubMed

Publication types

MeSH terms