. 2018 Dec 27;19(1):971.
doi: 10.1186/s12864-018-5350-1.

Discerning novel splice junctions derived from RNA-seq alignment: a deep learning approach

Affiliations

Discerning novel splice junctions derived from RNA-seq alignment: a deep learning approach

Yi Zhang et al. BMC Genomics. .

Abstract

Background: Exon splicing is a regulated cellular process in the transcription of protein-coding genes. Technological advancements and cost reductions in RNA sequencing have made quantitative and qualitative assessments of the transcriptome both possible and widely available. RNA-seq provides unprecedented resolution to identify gene structures and resolve the diversity of splicing variants. However, currently available ab initio aligners are vulnerable to spurious alignments due to random sequence matches and sample-reference genome discordance. As a consequence, a significant set of false positive exon junction predictions would be introduced, which will further confuse downstream analyses of splice variant discovery and abundance estimation.

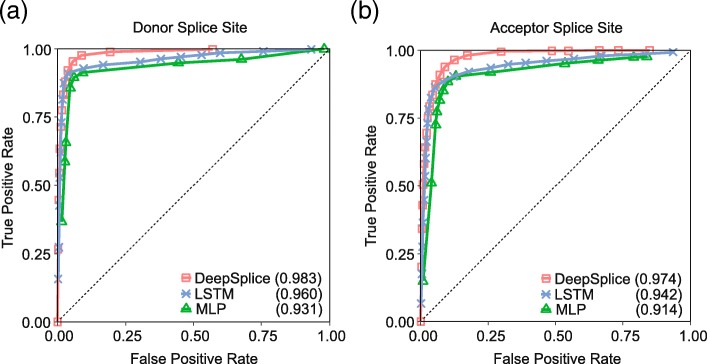
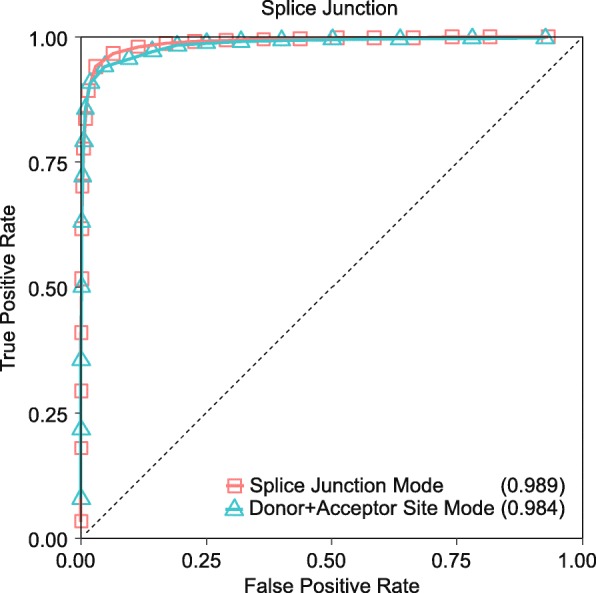
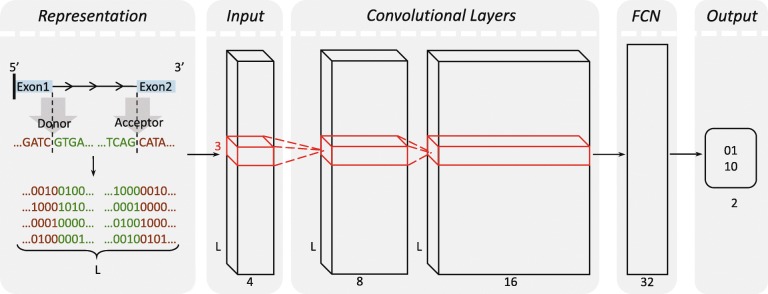
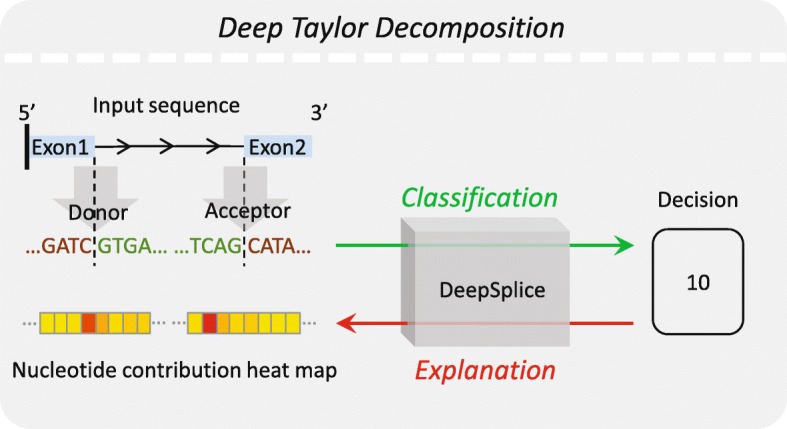
Results: In this work, we present a deep learning based splice junction sequence classifier, named DeepSplice, which employs convolutional neural networks to classify candidate splice junctions. We show (I) DeepSplice outperforms state-of-the-art methods for splice site classification when applied to the popular benchmark dataset HS3D, (II) DeepSplice shows high accuracy for splice junction classification with GENCODE annotation, and (III) the application of DeepSplice to classify putative splice junctions generated by Rail-RNA alignment of 21,504 human RNA-seq data significantly reduces 43 million candidates into around 3 million highly confident novel splice junctions.

Conclusions: A model inferred from the sequences of annotated exon junctions that can then classify splice junctions derived from primary RNA-seq data has been implemented. The performance of the model was evaluated and compared through comprehensive benchmarking and testing, indicating a reliable performance and gross usability for classifying novel splice junctions derived from RNA-seq alignment.

Keywords: Deep learning; Exon splicing; RNA-seq; Splice junction.


Conflict of interest statement

Ethics approval and consent to participate

No permission was required from the ethics committee as the project did not involve testing of human, animal or endangered plant species subjects.

Competing interests

The authors declare that they have no competing interests.

Publisher’s Note

Springer Nature remains neutral with regard to jurisdictional claims in published maps and institutional affiliations.

Figures

Fig. 1
Fig. 1
The ROC curves of DeepSplice, multilayer perceptron network (MLP) and long short-term memory network (LSTM) for (a) donor splice site and (b) acceptor splice site classification on the HS3D data set by 10-fold cross-validation. DeepSplice with convolutional neural network exceeds the other deep learning architectures, achieving an auROC score of 0.983 (0.974) on donor (acceptor) splice site classification
Fig. 2
Fig. 2
The ROC curves of DeepSplice Splice Junction Mode and Donor+Acceptor Site Mode for splice junction classification on the GENCODE data set. DeepSplice Splice Junction Mode achieves a higher auROC score of 0.989
Fig. 3
Fig. 3
Visualization of the contribution of nucleotides in the flanking splice sequences to the final decision function of DeepSplice on the HS3D dataset for (a) donor splice site and (b) acceptor splice site classification. For both donor and acceptor site classifiers, intronic bases close to GT-AG di-nucleotides achieve the most importance in the classifiers. In general, intron sequences carry more discriminative information than exon sequences
Fig. 4
Fig. 4
Visualization of the contribution of nucleotides in the flanking splice sequences to the final decision function of DeepSplice on the GENCODE dataset for splice junction classification. The nucleotides in the proximity of a splice junction have the highest impact on the classification outcome. As observed in the splice site classifiers, the contribution distribution of nucleotides in the flanking splice sequences indicates that intron nucleotides carry more discriminative information than exon nucleotides
Fig. 5
Fig. 5
Positive splice junctions tend to have high read support and contain the canonical flanking string. a Discrete proportions of negatives, positive semi-canonical splice junctions and positive canonical splice junctions from the classification results, given the average read support per sample. Splice junctions with average read support per sample more than 15 achieve a positive rate of around 88%. In contrast, for splice junctions with average read support per sample no more than 1, only 36% are identified as positive. There is a significant rise in the probability to obtain a positive splice junction with the increase of the average read support per sample. Around 99% positive splice junctions contain the canonical flanking string. b Cumulative proportions of positive semi-canonical and canonical splice junctions with the increase of the average read support per sample
Fig. 6
Fig. 6
Positive splice junctions tend to have both donor and acceptor sites annotated. a Discrete proportions of negatives, positive splice junctions without annotated site, positive splice junctions with acceptor site annotated, positive splice junctions with donor site annotated and positive splice junctions with two sides annotated, given the average read support per sample. 97% of splice junctions with both sites annotated are classified as positives, while only 39% with both sites being novel are positive. Splice junctions connecting annotated splice sites also tend to be associated with higher read coverage. b Cumulative proportions of positive splice junctions in each category with the increase of the average read support per sample
Fig. 7
Fig. 7
Splice sites which maintain the coding frame of the exon are observed more often than those which disrupt frame. Positive splice junctions in intropolis near known protein-coding junctions show a periodic pattern. For each donor (acceptor) site in the positive splice junctions, we calculated its distance to the nearest annotated donor (acceptor) site, and then counted the frequency for each position. The red points denote positions that are a multiple of three base pairs from the major splice form, and the black points those that are not
Fig. 8
Fig. 8
Visualization of splice junction sequence representation and deep convolutional neural network in DeepSplice. Each sequence is converted into a tensor through one-hot encoding in the pre-processing of the sequence representation. The tensor is fed as original input to the deep convolutional neural network, which contains one input layer, two convolutional layers, one fully connected layer (FCN) and one output layer. The convolutional neural network transforms the nucleotide signal in splice junction sequences to the final label of class
Fig. 9
Fig. 9
Visualization of deep Taylor decomposition in DeepSplice. Deep Taylor decomposition explains the contribution of each nucleotide in the splice junction sequence to the final decision function of the deep convolutional neural network. Deep Taylor decomposition operates by running a backward pass on the trained convolutional neural network using a predefined set of rules
Fig. 10
Fig. 10
Illustration of splice junction filtering strategy. In this example, two edit distances are calculated. One (Ed) is between anchor sequence at donor site (G [Jd-Ad + 1:Jd]) and intermediate flanking sequence next to acceptor site (G [Ja-Aa:Ja-1]). The other (Ea) is between anchor sequence at acceptor site (G [Ja:Ja + Aa-1]) and intermediate flanking sequence next to donor site (G [Jd + 1:Jd + Ad])

Similar articles

Cited by

References

    1. Wang ET, et al. Alternative isoform regulation in human tissue transcriptomes. Nature. 2008;456(7221):470–476. - PMC - PubMed
    1. Roy B, Haupt LM, Griffiths LR. Review: alternative splicing (AS) of genes as an approach for generating protein complexity. Curr Genomics. 2013;14(3):182–194. - PMC - PubMed
    1. Cloonan N, et al. Stem cell transcriptome profiling via massive-scale mRNA sequencing. Nat Methods. 2008;5(7):613–619. - PubMed
    1. Marioni JC, et al. RNA-seq: an assessment of technical reproducibility and comparison with gene expression arrays. Genome Res. 2008;18(9):1509–1517. - PMC - PubMed
    1. Mortazavi A, et al. Mapping and quantifying mammalian transcriptomes by RNA-Seq. Nat Methods. 2008;5(7):621–628. - PubMed