. 2019 Feb;21(2):172-184.
doi: 10.1016/j.neo.2018.11.003. Epub 2018 Dec 31.

Trabectedin Reduces Skeletal Prostate Cancer Tumor Size in Association with Effects on M2 Macrophages and Efferocytosis

Affiliations

Trabectedin Reduces Skeletal Prostate Cancer Tumor Size in Association with Effects on M2 Macrophages and Efferocytosis

J D Jones et al. Neoplasia. 2019 Feb.

Abstract

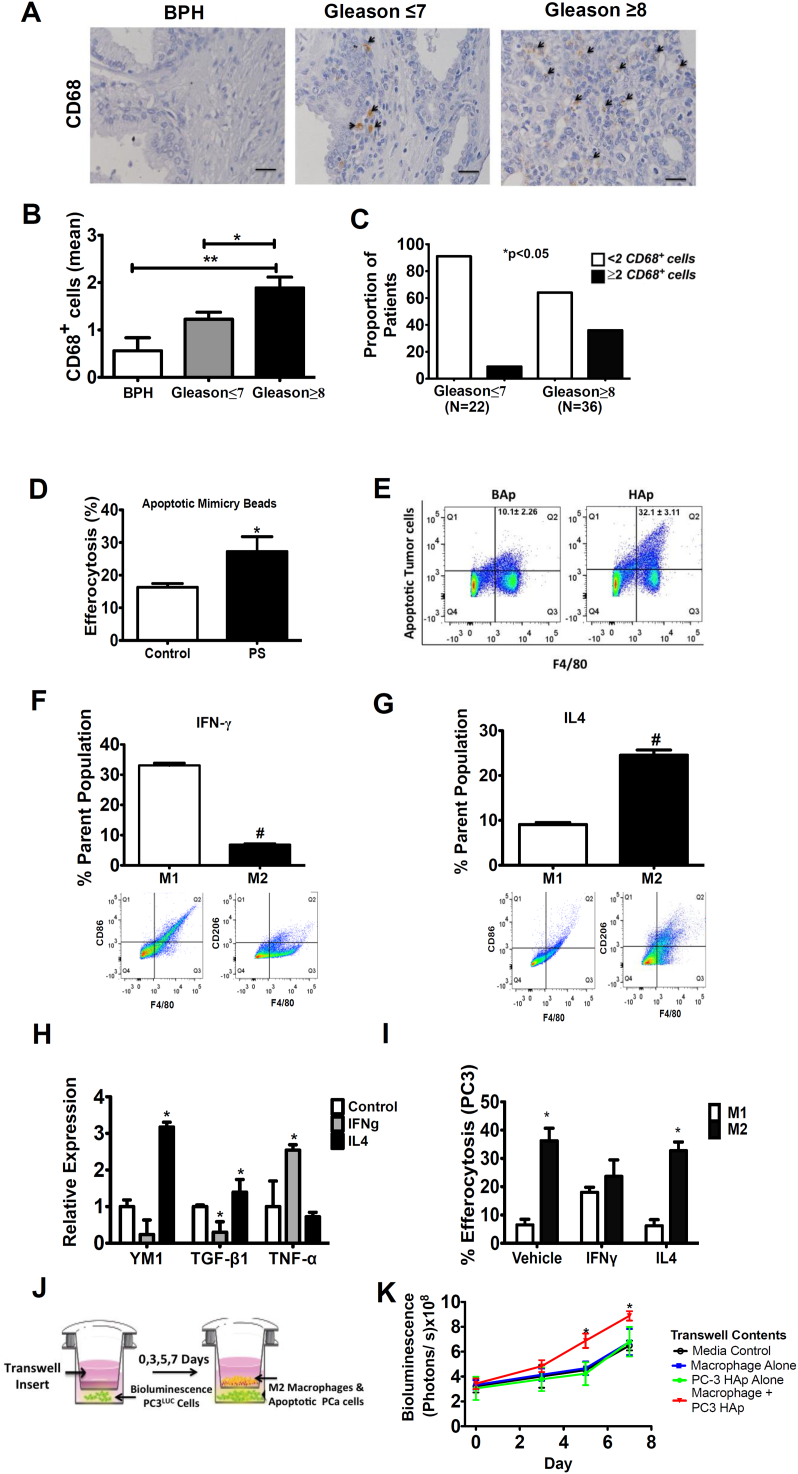
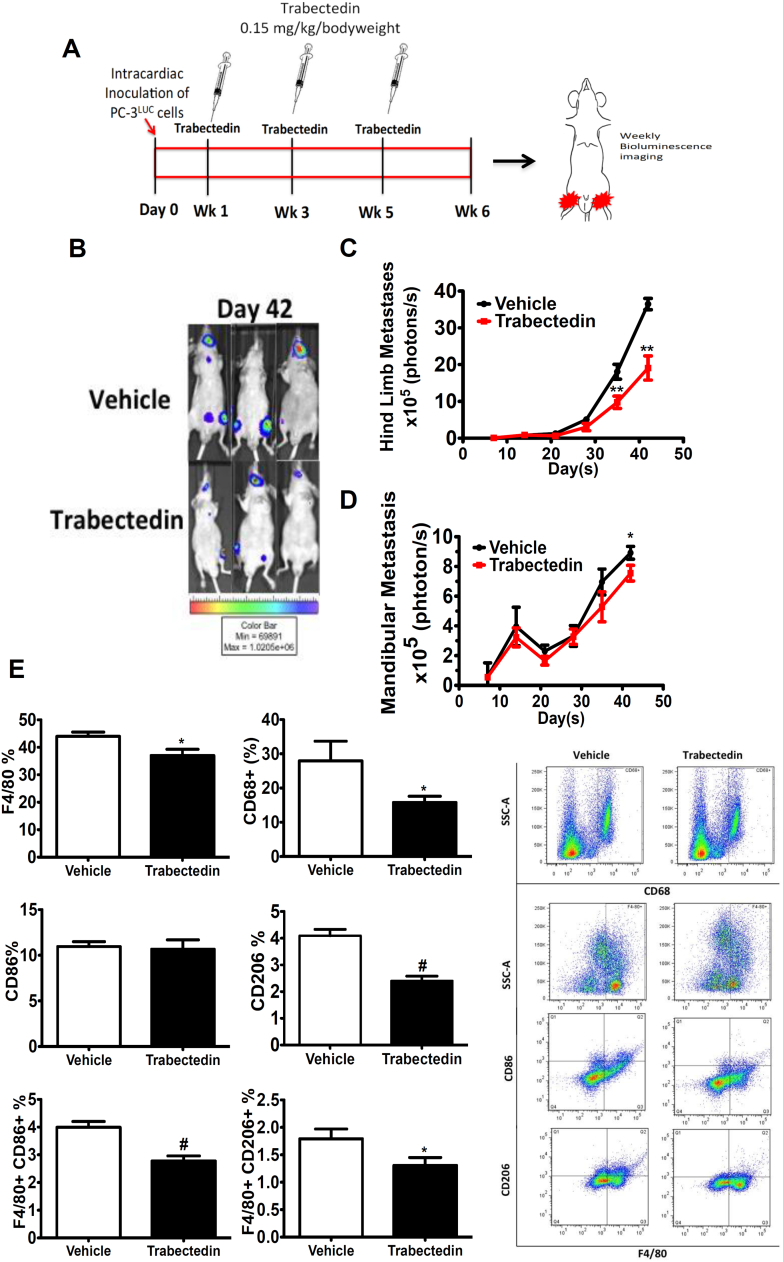
Macrophages play a dual role in regulating tumor progression. They can either reduce tumor growth by secreting antitumorigenic factors or promote tumor progression by secreting a variety of soluble factors. The purpose of this study was to define the monocyte/macrophage population prevalent in skeletal tumors, explore a mechanism employed in supporting prostate cancer (PCa) skeletal metastasis, and examine a novel therapeutic target. Phagocytic CD68+ cells were found to correlate with Gleason score in human PCa samples, and M2-like macrophages (F4/80+CD206+) were identified in PCa bone resident tumors in mice. Induced M2-like macrophages in vitro were more proficient at phagocytosis (efferocytosis) of apoptotic tumor cells than M1-like macrophages. Moreover, soluble factors released from efferocytic versus nonefferocytic macrophages increased PC-3 prostate cancer cell numbers in vitro. Trabectedin exposure reduced M2-like (F4/80+CD206+) macrophages in vivo. Trabectedin administration after PC-3 cell intracardiac inoculation reduced skeletal metastatic tumor growth. Preventative pretreatment with trabectedin 7 days prior to PC-3 cell injection resulted in reduced M2-like macrophages in the marrow and reduced skeletal tumor size. Together, these findings suggest that M2-like monocytes and macrophages promote PCa skeletal metastasis and that trabectedin represents a candidate therapeutic target.


Figures

Figure 1
Figure 1
Phagocytic CD68+ cells are positively associated with high Gleason scores, and macrophage efferocytosis supports prostate cancer cell growth. (A) Representative images of CD68 immunohistochemistry in prostate cancer tissue microarray specimens including BPH (n=16), Gleason ≤7 (n=22), and Gleason ≥8 (n=36). Arrowheads (black) indicate cells positive for CD68. Images are taken at 400-fold magnification. (B) Quantitative analysis of tissue specimens for the sum of CD68+ cells in four different fields of view. Measured images were taken at 20× for analysis. Data are mean ± SE, *P<.05, **P<.01. (C) The association of two or more CD68+ cells in tissue by patient’s Gleason score was tested using Fisher’s exact test. Significance was set at *P<.05. (D-E) Murine bone marrow–derived macrophages were cultured with PS-coated apoptotic mimicry beads (3:1) or fluorescently labeled apoptotic PC-3 cells (2:1) ex vivo, and efferocytosis was analyzed using flow cytometry for ingested beads/cells. (D) PE-labeled and unlabeled PS-coated apoptotic mimicry beads were cultured with freshly isolated bone marrow cells and analyzed by flow cytometry for F4/80+ cells with ingested beads. Data are mean ± SE (n=4/group), *P<.05. (E) UV-induced apoptotic prostate cancer PC-3 cells (>60% high apoptosis, HAp) or noninduced PC-3 cells (<10% basal apoptosis, BAp) were cultured with freshly isolated bone marrow cells and analyzed by flow cytometry for F4/80+ cells with ingested PE-labeled apoptotic tumor cells. Representative images shown with data indicated at upper right as mean ± SE (n=4/group), P<.05. (F-I) Pretreatment with IL4 and IFN-γ induced polarization into M1 or M2-like macrophages. (F,G) Cell surface markers F4/80, CD86, and CD206 were used to identify polarized macrophage populations using flow cytometry. Percent (%) parent population indicates the number of positive cells in the percentage of total cell population. Data are mean ± SE (n=4/group), #P<.0001. Representative flow cytometry images are below. (H) Relative gene expression of YM1, TGF-β, and TNF-α in polarized macrophages. Data are mean ± SE (n=4/group), *P<.05 vs. control. (I) Macrophage efferocytosis using fluorescently labeled HAp (PC-3) tumor cells as bait to determine the preferential behavior of polarized M1 (IFN-γ) versus M2 (IL-4) macrophages. Data are mean ± SE (n=4/group), *P<.05. (J) Schematic representation of experimental design to evaluate the effect of macrophages on PC-3 cell proliferation. (K) PC-3Luc cells as shown in F were used to measure cell growth as a result of macrophage efferocytosis using a Transwell assay. Data are mean ± SE (n=3/group), *P<.05 vs. all other groups.
Figure 2
Figure 2
Single dose of trabectedin significantly reduces M2-like bone marrow cells in vivo. (A) Schematic representation of the experimental design. Male athymic mice were divided into two groups and treated with a single intravenous injection of saline or trabectedin (0.15 kg/mg/bodyweight). Seven days postadministration, whole blood and bone marrow cells were collected. (B) Monocytes were isolated from whole blood and flow cytometric analyses performed for CD11b+, CD45+, and CD115+ cells. Representative flow cytometric analyses are shown. Data are mean ± SE (n=5/group), *P<.05 vs. vehicle. (C) Bone marrow cells were isolated and analyzed for markers F4/80, CD68, CD86, and CD206 using flow cytometric analyses. Representative flow cytometric analyses are shown. Data are mean ± SE (n=5/group), *P<.05, ***P<.001 vs. vehicle.
Figure 3
Figure 3
Ablation of M2-like bone marrow cells retards prostate cancer tumor growth. (A) Schematic representation of the experimental design (preventative pretreatment regimen). Male athymic mice were divided into two groups and treated with a single injection of saline control (n=10) or trabectedin (n=8). Seven days after initial treatment (0.15 kg/mg/bodyweight), PC-3Luc cells were injected into the bone marrow space of both the left and right tibiae, and mice were followed for 42 days. (B) Tumor growth in the hind limbs was measured weekly using bioluminescence. *P<.05 vs. vehicle. (C) Whole blood was collected, and monocytes were isolated and analyzed with flow cytometry for CD11b, CD45, and CD115 (with representative flow cytometric analyses). Data are mean ± SE, *P<.05 vs. vehicle. (D) Bone marrow cells were isolated and analyzed for markers F4/80, CD68, CD86, and CD206 using flow cytometric analysis (with representative flow cytometric analyses). Data are mean ± SE, *P<.05 vs. vehicle.
Figure 4
Figure 4
Immunohistochemistry of trabectedin-treated murine intratibial prostate tumors. Immunohistochemistry was performed on orthotopic tibial sections of vehicle- (n=10) and trabectedin- (n=8) treated mice as described in Figure 3. Representative images are at 400× magnification. Staining was quantified by counting three different fields of view per specimen. Arrows indicate positive cells. Data are mean ± SE. (A-B) Representative CD68 staining and quantitative analysis, *P<.05 vs. vehicle. (C-D) Representative CD206 staining and quantitative analysis,**P<.01 vs. vehicle. (E-F) Representative TRAP staining and quantification of positive osteoclastic cells (indicated by arrows) per mm of bone. There was no significant difference in osteoclast numbers.
Figure 5
Figure 5
M2-like monocytes and macrophages in experimental prostate cancer skeletal metastasis model. (A) Schematic of the experimental design (therapeutic treatment regimen). Male athymic mice were divided into two groups and were injected with PC-3Luc in the left ventricle of the heart. Trabectedin was subsequently administered (0.15 kg/mg/bodyweight) in three doses: 7 days after tumor inoculation, at week 3, and at week 5. (B) Representative images of in vivo bioluminescence on day 42. (C) Hind limb metastatic tumor growth was measured by weekly in vivo bioluminescence imaging. Data are mean ± SE, **P<.01 vs. vehicle. (D) Mandibular metastatic tumor size was measured by weekly in vivo bioluminescence imaging. Data are mean ± SE, *P<.05 vs. vehicle. (E) Bone marrow cells were isolated and analyzed for markers F4/80, CD68, CD86, and CD206 using flow cytometric analysis (representative flow cytometric analyses at right). Data are mean ± SE, *P<.05, #P<.0001 vs. vehicle.
Figure 6
Figure 6
Modulation of polarized bone marrow–derived macrophages. (A) IL-4–treated macrophages (M2-like) were more susceptible to trabectedin treatment (10 nM) than IFN-γ treated (M1-like) in vitro. Viable cell numbers were normalized to untreated polarized macrophages. Data are mean ± SE (n=5/group), *P<.05. (B-C) Flow cytometric analysis of polarized macrophages untreated or treated with trabectedin in vivo. (B) TRAILR2+; (C) CD115+. Data are mean ± SE (n=4/group), *P<.05, **P<.01, ***P<.001. (D-E) Images and quantification for Western blot. (D) TRAILR2; (E) CD115. Experiments were repeated three times. Data are a mean ± SE, *P<.05. (F). Quantification of bone marrow expanded osteoclasts using RANKL, treated or untreated with trabectedin. Data are mean ± SE, #P<.0001.

References

    1. Weilbaecher KN, Guise TA, McCauley LK. Cancer to bone: a fatal attraction. Nat Rev Cancer. 2011;11(6):411–425. - PMC - PubMed
    1. Sica A, Schioppa T, Mantovani A, Allavena P. Tumour-associated macrophages are a distinct M2 polarised population promoting tumour progression: potential targets of anti-cancer therapy. Eur J Cancer. 2006;42(6):717–727. - PubMed
    1. Marvel D, Gabrilovich DI. Myeloid-derived suppressor cells in the tumor microenvironment: expect the unexpected. J Clin Invest. 2015;125(9):3356–3364. - PMC - PubMed
    1. Subimerb C, Pinlaor S, Lulitanond V, Khuntikeo N, Okada S, McGrath MS, Wongkham S. Circulating CD14+CD16+ monocyte levels predict tissue invasive character of cholangiocarcinoma. Clin Exp Immunol. 2010;161(3):471–479. - PMC - PubMed
    1. Saleh MN, Goldman SJ, LoBuglio AF, Beall AC, Sabio H, McCord MC, Minasian L, Alpaugh RK, Weiner LM, Munn DH. CD16+ monocytes in patients with cancer: spontaneous elevation and pharmacologic induction by recombinant human macrophage colony-stimulating factor. Blood. 1995;85(10):2910–2917. - PubMed

Publication types

MeSH terms